1. 이번 편의 전제와 목표
전제
- Suricata는 NAT Instance에서 이미 동작 중
- 해당 NAT Instance에 ELK를 전부 설치
- 구조 :
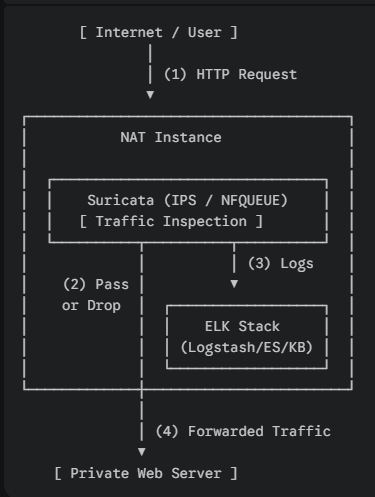
이번 편에서 끝낼 것
- NAT Instance에
- Elasticsearch 설치 및 기동
- Kibana 설치 및 접속
- Logstash 설치
- 로그 연동은 하지 않는다
→ 6편에서 Logstash 필터 + Suricata eve.json 본격 처리
2. NAT Instance 사양 및 주의사항
최소 사양 (실습 기준)
- Instance Type: 최소 t3.medium / 권장 : t3.xlarge
- t3.small 이하 → Elasticsearch에서 병목 현상 발생할 가능성 있음.
- RAM: 4GB 이상
- Disk: 20GB 이상
Suricata IPS + ELK를 한 인스턴스에 몰아넣는 건 실습용이다.
운영 환경에서는 절대 이렇게 하지 않도록 한다.
3. 커널 파라미터 설정 (필수)
Elasticsearch는 이거 없으면 100% 경고 또는 기동 실패
root@nat:/home/ubuntu# sysctl vm.max_map_count
설정:
# echo "vm.max_map_count=262144" > /etc/sysctl.d/99-elasticsearch.conf
# sysctl --system
# sysctl vm.max_map_count
4. Elastic APT 저장소 등록
# apt update
# apt install -y curl gnupg apt-transport-https ca-certificates
# wget -qO - https://artifacts.elastic.co/GPG-KEY-elasticsearch \
| gpg --dearmor -o /usr/share/keyrings/elastic-keyring.gpg
# echo \
"deb [signed-by=/usr/share/keyrings/elastic-keyring.gpg] \
https://artifacts.elastic.co/packages/8.x/apt stable main" \
> /etc/apt/sources.list.d/elastic-8.x.list# apt update5. Elasticsearch 설치 및 설정
5.1 설치
# apt install -y elasticsearch
5.2 Elasticsearch 설정 (단일 노드)
# vi /etc/elasticsearch/elasticsearch.yml
아래 항목만 정확하게 지정:
주석 제거 :

cluster.name: suricata-lab
node.name: nat-elk-1
network.host: 0.0.0.0
http.port: 9200

설정 추가 :

discovery.type: single-node
NAT Instance라서
0.0.0.0바인딩 사용
대신 Security Group에서 9200 외부 공개 금지
5.3 JVM Heap 설정 (중요)
💡 왜 메인 파일(jvm.options)을 수정 안하나?
원래 /etc/elasticsearch/jvm.options 라는 메인 설정 파일이 있다. 하지만 그걸 직접 고치면, 나중에 Elasticsearch 업데이트할 때 설정이 덮어씌워지거나 충돌 가능성이 있다.
그래서 “건드리지 말고 .d 폴더에 너만의 파일을 따로 만들어둬, 내가 알아서 읽어갈게” 라고 만들어둔 게 jvmp.options.d 폴더임
아래 처럼 파일을 추가한다.
# vi /etc/elasticsearch/jvm.options.d/heap.optionsRAM 4GB 기준:
-Xms1g
-Xmx1g
5.4 Elasticsearch 기동
# systemctl daemon-reload
# systemctl enable --now elasticsearch
상태 확인:
# systemctl status elasticsearch[Troubleshooting] Elasticsearch 8.x 기동 실패 및 설정 충돌 해결
1. 현상
- Elasticsearch 서비스를 시작했으나 실패함 (
systemctl start elasticsearch→Job for elasticsearch.service failed). journalctl확인 시exit code 1로 fail 확인됨.
2. 로그 분석
구체적인 원인을 파악하기 위해 메인 로그 파일의 뒷부분을 확인.
명령어:
# tail -n 50 /var/log/elasticsearch/<클러스터명>.log
 예: tail -n 50 /var/log/elasticsearch/suricata-lab.log
발견된 핵심 에러 로그:
java.lang.IllegalArgumentException: setting [cluster.initial_master_nodes] is not allowed when [discovery.type] is set to [single-node]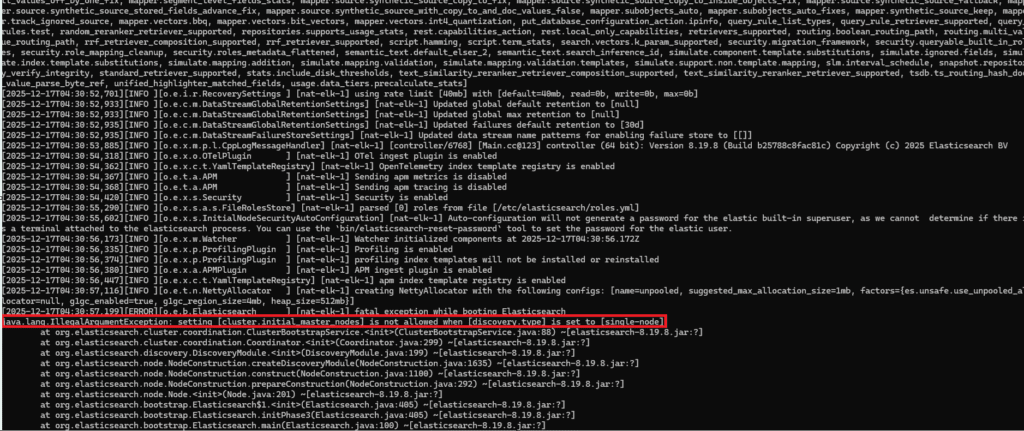
3. 원인 분석
- 설정 충돌:
single-node(단일 노드 모드) 설정과initial_master_nodes(클러스터 마스터 명시) 설정은 동시에 존재할 수 없음. - 자동 변경 이슈: 사용자가
single-node만 설정했더라도, Elasticsearch 8.x 버전은 최초 부팅(First Boot) 시 보안 자동 구성(Auto-configuration) 과정에서 현재 호스트네임(예:suricata)을 감지하여cluster.initial_master_nodes설정을elasticsearch.yml파일에 자동으로 추가(Append) 함. - 이로 인해 의도치 않은 설정 충돌이 발생하여 부팅이 차단됨.
4. 해결 방법
자동으로 추가된 cluster.initial_master_nodes 설정을 비활성화해야 함.
1) 설정 파일 편집
# vi /etc/elasticsearch/elasticsearch.yml
2) 충돌 라인 주석 처리 : 파일 하단(또는 중간)에 자동으로 추가된 라인을 찾아 앞에 주석을 붙임.
변경 전 (에러 발생) :
cluster.initial_master_nodes: ["suricata"]
discovery.type: single-node

변경 후 (수정 완료) :
# cluster.initial_master_nodes: ["suricata"]  <-- 주석 처리
discovery.type: single-node
3) 재시작 및 확인
# systemctl enable --now elasticsearch5.5 elastic 계정 비밀번호 설정
Elastic 8.x는 보안이 기본 활성화다.
# /usr/share/elasticsearch/bin/elasticsearch-reset-password -u elastic→ 출력되는 비밀번호 반드시 저장
5.6 Elasticsearch 정상 확인
# curl -k https://localhost:9200
# curl -k -u elastic https://localhost:9200
6. Kibana 설치 및 연동
6.1 Kibana 설치
# apt install -y kibana6.2 Kibana 설정
# vi /etc/kibana/kibana.yml
server.host: "0.0.0.0"
server.port: 5601
6.3 Kibana Enrollment Token 생성
# /usr/share/elasticsearch/bin/elasticsearch-create-enrollment-token -s kibana6.4 Kibana 기동
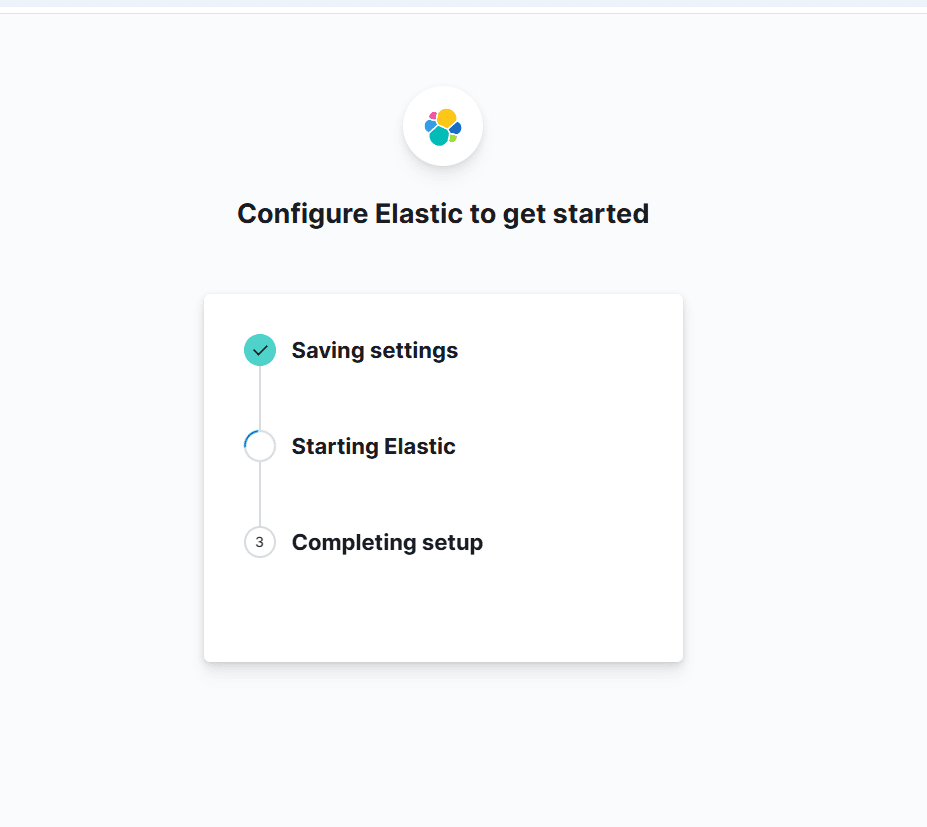
# systemctl enable --now kibana
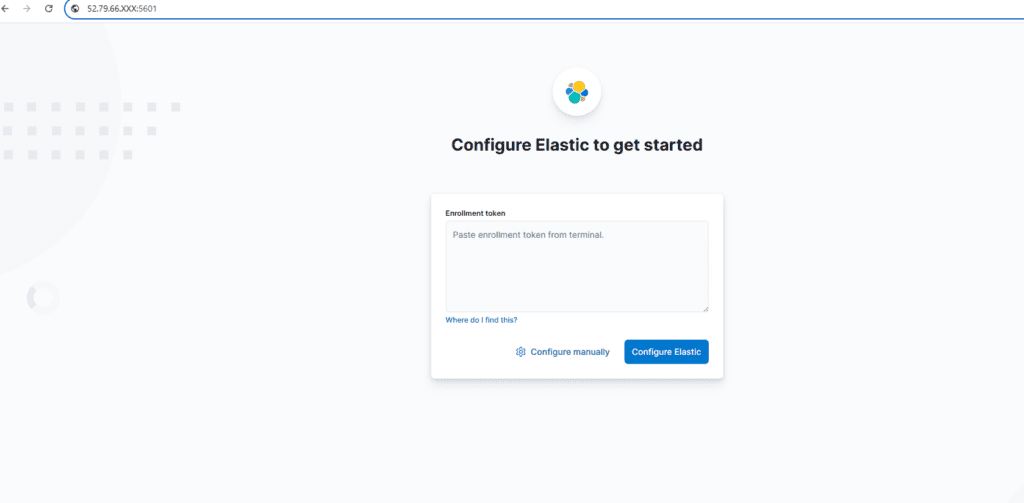
# systemctl status kibana 6.5 Kibana 접속
브라우저로 아래와 같이 접속 및 위에서 생성한 token 복사.붙여넣기
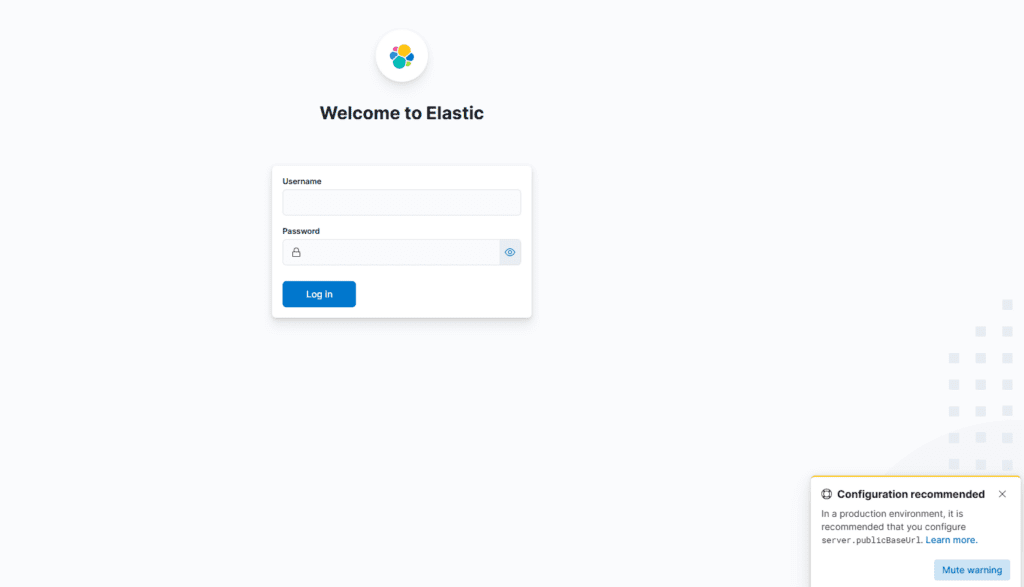
http://<NAT_PUBLIC_IP>:5601순서:
- Enrollment token 입력
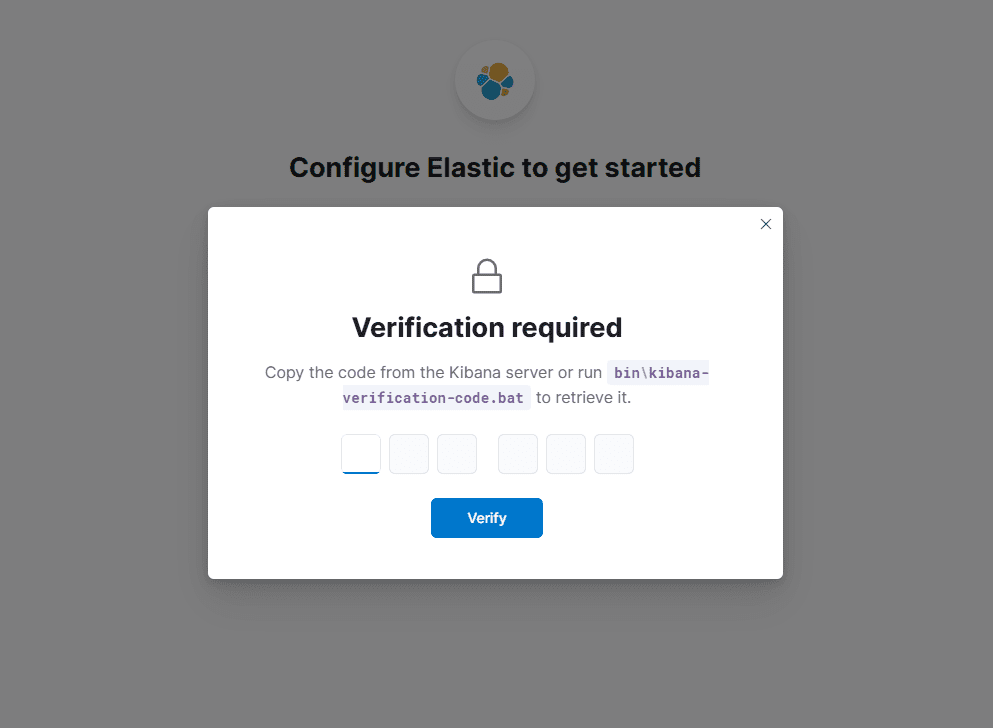
- 검증 코드 입력(Verification Code) : 아래 명령어 enter 후 나오는 코드 입력.
# /usr/share/kibana/bin/kibana-verification-code - 로그인:
- user:
elastic - password: 앞에서 설정한 elastic 계정 비밀번호
- user:


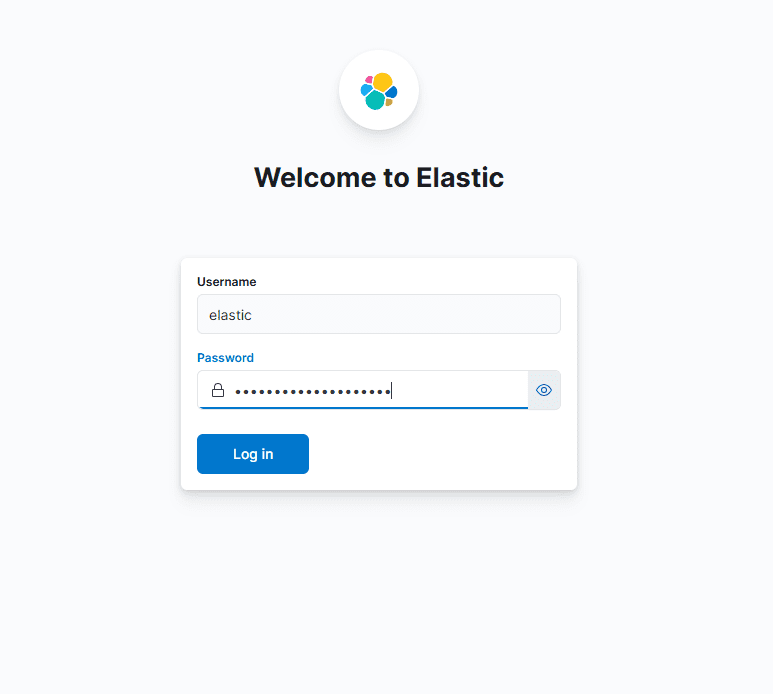
7. Logstash 설치
이번 편에서는 설치 + 서비스 기동까지만 한다.
# apt install -y logstash
# systemctl enable --now logstash
# systemctl status logstash
8. 최종 체크리스트
# systemctl is-active elasticsearch
# systemctl is-active kibana
# systemctl is-active logstash
# ss -lntp | egrep '9200|5601'
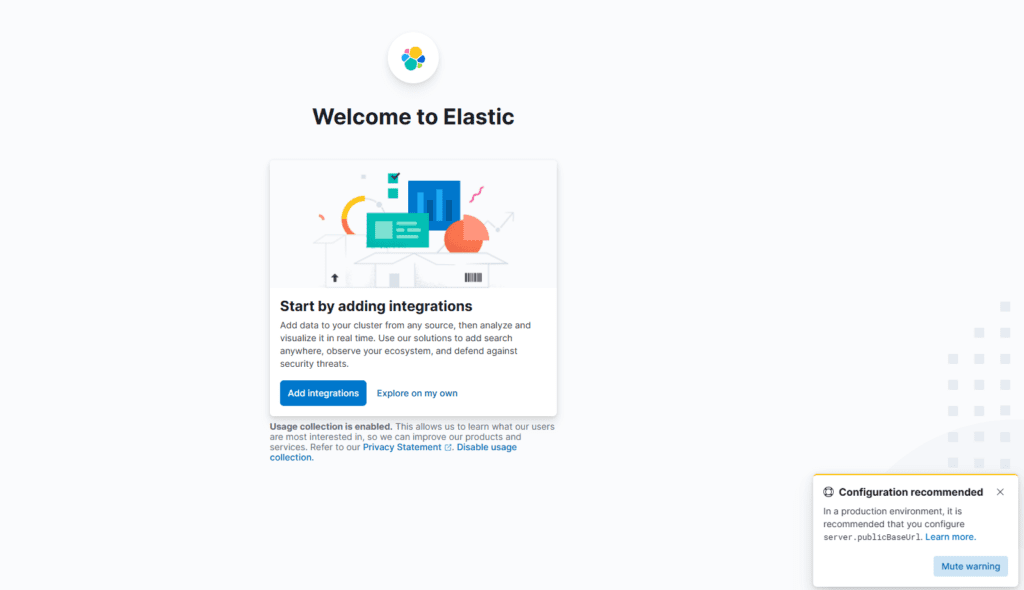
Kibana 접속 확인:
- Management 화면 정상 로딩
다음 6편 예고
- Suricata
eve.json→ Logstash input - filter:
- alert / drop 구분
- rule.sid / msg / src_ip / dest_ip 정리
- Elasticsearch 인덱스 설계
- Kibana 대시보드:
- Alert vs Drop
- Top Attacker IP
- Rule Hit Ranking 등
🛠 마지막 수정일: 2025.12.23
ⓒ 2025 엉뚱한 녀석의 블로그 [quirky guy's Blog]. All rights reserved. Unauthorized copying or redistribution of the text and images is prohibited. When sharing, please include the original source link.
💡 도움이 필요하신가요?
Zabbix, Kubernetes, 그리고 다양한 오픈소스 인프라 환경에 대한 구축, 운영, 최적화, 장애 분석,
광고 및 협업 제안이 필요하다면 언제든 편하게 연락 주세요.
📧 Contact: jikimy75@gmail.com
💼 Service: 구축 대행 | 성능 튜닝 | 장애 분석 컨설팅
📖 E-BooK [PDF] 전자책 (Gumroad):
Zabbix 엔터프라이즈 최적화 핸드북
블로그에서 다룬 Zabbix 관련 글들을 기반으로 실무 중심의 지침서로 재구성했습니다.
운영 환경에서 바로 적용할 수 있는 최적화·트러블슈팅 노하우까지 모두 포함되어 있습니다.
💡 Need Professional Support?
If you need deployment, optimization, or troubleshooting support for Zabbix, Kubernetes,
or any other open-source infrastructure in your production environment, or if you are interested in
sponsorships, ads, or technical collaboration, feel free to contact me anytime.
📧 Email: jikimy75@gmail.com
💼 Services: Deployment Support | Performance Tuning | Incident Analysis Consulting
📖 PDF eBook (Gumroad):
Zabbix Enterprise Optimization Handbook
A single, production-ready PDF that compiles my in-depth Zabbix and Kubernetes monitoring guides.
답글 남기기
댓글을 달기 위해서는 로그인해야합니다.