Version note (important): Zabbix publishes different Helm repos per version (7.4 / 7.2 / 7.0 LTS).
The examples below use 7.4. If your running Zabbix server/templates are on a different version, change <ZBX_VER> accordingly.
Repo pattern:https://cdn.zabbix.com/zabbix/integrations/kubernetes-helm/<ZBX_VER>/
0) Prerequisites
- Kubernetes 1.23+ (recommend 1.24+) with
kubectlandhelm - Zabbix Server or Proxy can reach the cluster over TCP 10050/10051
- Target namespace in this guide:
monitoring
1) Add the repo (pick your version)
- Choose a Zabbix version to match your server/templates (7.4 / 7.2 / 7.0)
# export ZBX_VER=7.4

- Namespace
# kubectl create namespace monitoring 2>/dev/null || true

- Add/update the versioned Helm repo
# helm repo add zabbix-chart-${ZBX_VER} https://cdn.zabbix.com/zabbix/integrations/kubernetes-helm/${ZBX_VER}/

# helm repo update
2) Dump default values → edit a single file
- Save chart defaults to a local file
# helm show values zabbix-chart-${ZBX_VER}/zabbix-helm-chrt > zabbix_values.yaml
Open zabbix_values.yaml and adjust for your environment. Below is an example for 7.4, with proxy enabled and a single-node agent2.
⚠️ The hostnames/IPs shown are placeholders for documentation. Replace them with your real values.
1. Assign kube-state-metrics to a specific node

kubeStateMetrics.enabled deploys the kube-state-metrics component, which provides real-time Kubernetes object states such as Deployments, Pods, and Node conditions.
Add a nodeSelector under the kubeStateMetrics block.
If the target node has a taint, define tolerations accordingly.
If the block name is written as kubeStateMetrics, rename it to kube-state-metrics.

kube-state-metrics:
 enabled: true
 nodeSelector:
  kubernetes.io/hostname: example-node1

2. Deploy Zabbix Proxy to a specific node

zabbixProxy:
 enabled: true
 nodeSelector:
  kubernetes.io/hostname: example-node1
 tolerations: [] # add if the node has taints
 affinity: {} # optional fine-grained control

#Set the Zabbix proxy hostname using the following variable:
- name: ZBX_HOSTNAME
  value: example-proxy         — this will be the name you’ll later use when registering the proxy in the Zabbix Web UI.

#Since version 6.0, the variable ZBX_SERVER_PORT is no longer supported.
Instead, append a colon (:) followed by the port number to the end of the ZBX_SERVER_HOST value, as shown below:

- name: ZBX_SERVER_HOST
  value: "Zabbix server IP"

3. Restrict Zabbix Agent to a specific node (Agent runs as a DaemonSet)

If enabled: false, You can skip step 3) — “Stop any host-level agent2 on target nodes".
In this case, set it to true.

zabbixAgent:
 enabled: true
 nodeSelector:
  kubernetes.io/hostname: example-node1
 # Since it’s a DaemonSet, only one Pod will be deployed on the matching node (example-node1).

Comment out the default OS selector to prevent conflicts.

#nodeSelector:
# kubernetes.io/os: linux

4. Deploy Zabbix Java Gateway to a specific node

We’ll keep it false for now. If you enable it, configure as follows.

zabbixJavaGateway:
 enabled: true # set to false if not used
 nodeSelector:
  kubernetes.io/hostname: example-node1

5. Update Zabbix Server IP

Zabbix server host

name: ZBX_SERVER_HOST
 value: <actual server IP>

In most cases, modifying these configurations is sufficient for normal operation, but you can further adjust parameters such as resources, tolerations, or hostNetwork depending on your environment.
If needed, tune
resources,tolerations,hostNetwork, etc., in the same file.
The point is: edit one file and deploy.
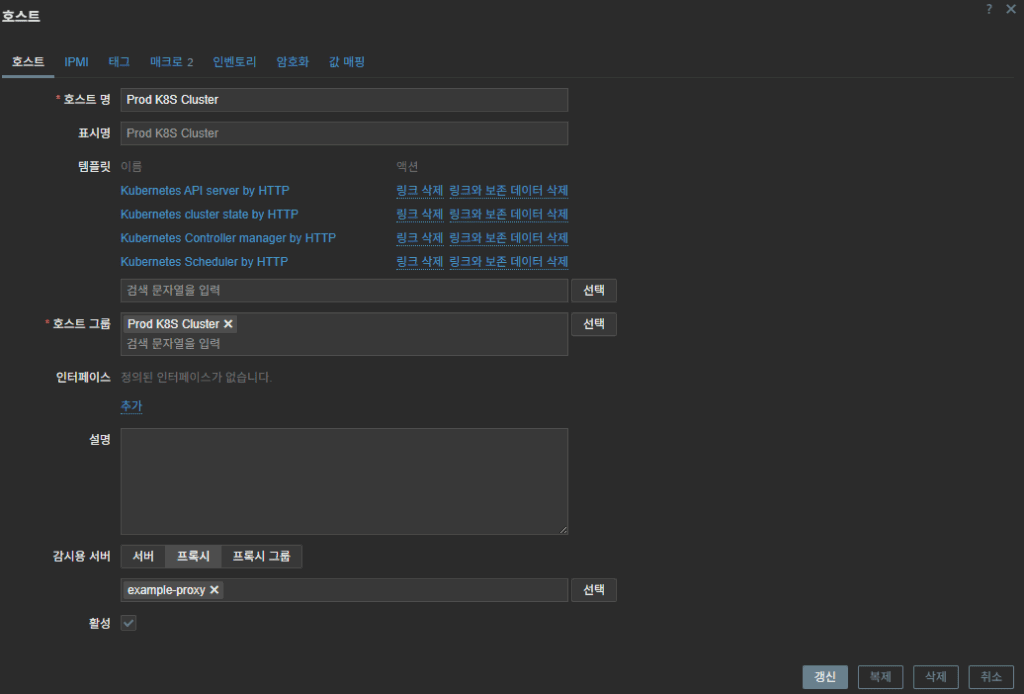
In the Zabbix Web UI, navigate to Administration → Proxies,
create a new proxy by specifying its name, and click Add.Then, when linking the template to Prod K8S Cluster,
select that proxy in the Monitored by proxy option.Among the templates, “Kubernetes cluster state by HTTP” cannot collect data if the Zabbix server is located outside the Kubernetes cluster,
so a Zabbix proxy is required
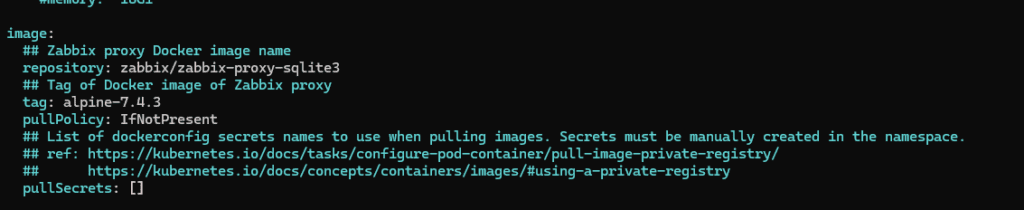
You should keep the Zabbix Proxy version in zabbix_values.yaml aligned with the Zabbix Server version.
For example, if the Zabbix Server is running 7.4.3, configure the proxy version to match it, as shown below.
3) Stop any host-level agent2 on target nodes
- Stop/disable host-based zabbix-agent2
# systemctl stop zabbix-agent2
# systemctl disable zabbix-agent2
- Nodes without a Pod-based agent can keep their existing host agent2 (no conflict).
- Nodes with the Pod-based agent should have the host agent2 stopped to avoid port conflicts and duplicate collection.
4) Install with Helm
#helm install zabbix zabbix-chart-${ZBX_VER}/zabbix-helm-chrt \
  -n monitoring \
  --dependency-update \
  -f zabbix_values.yaml

- Check
# kubectl -n monitoring get pods -o wide

- After installing Zabbix via Helm, update the values.yaml file and redeploy.
# helm upgrade --install zabbix zabbix-chart-${ZBX_VER}/zabbix-helm-chrt   -n monitoring   -f zabbix_values.yaml
5) ServiceAccount token
# kubectl -n monitoring get secret zabbix-service-account -o jsonpath='{.data.token}' | base64 -d; echo6) Apply Zabbix templates (conflict-avoidance principle)
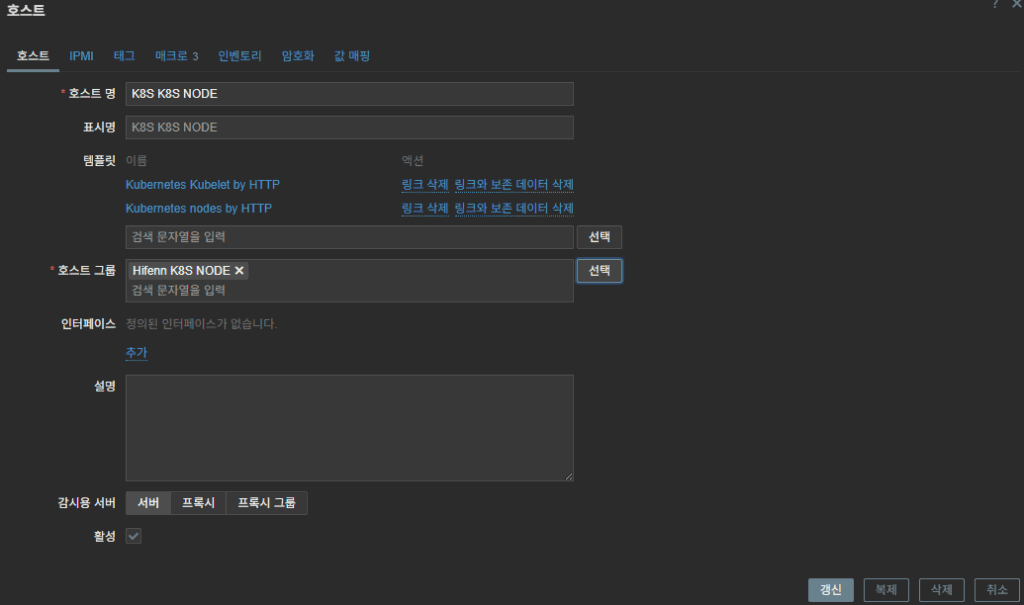
- Host K8S Cluster: Attach “Kubernetes cluster state by HTTP” and any other remaining templates
- Host K8S NODE : Kubernetes Kubelet by HTTP / Kubernetes Nodes by HTTP Connection
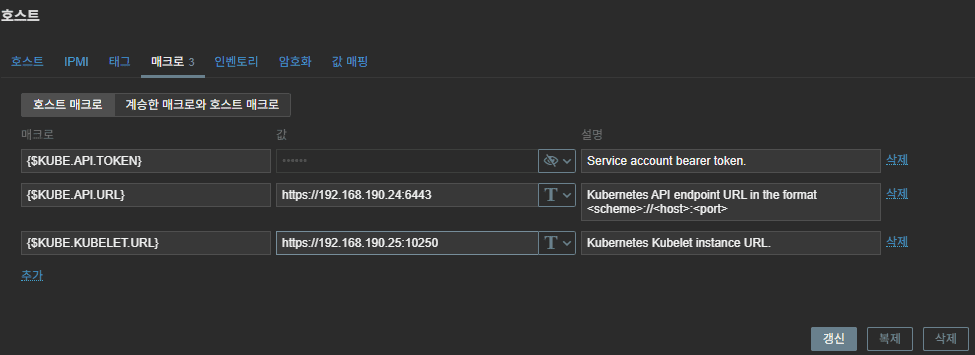
Common macros (typical):
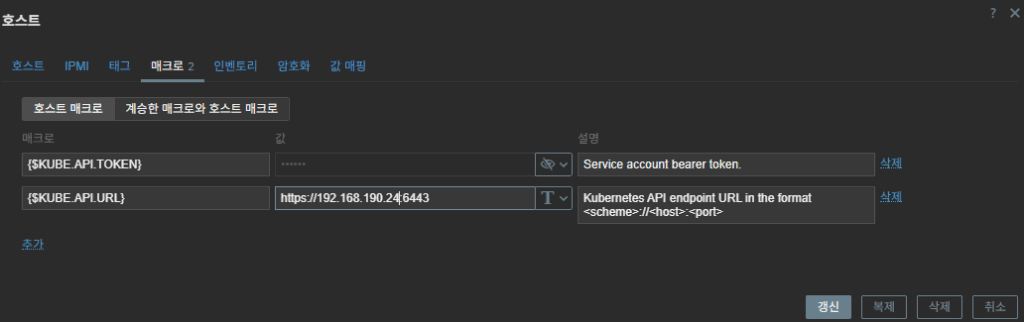
{$KUBE.API.TOKEN}= (the SA token issued above){$KUBE.KUBELET.URL}=https://<node-ip>:10250{$KUBE.API.URL}=https://<apiserver ip>:6443- Depending on the situation, you can also add:
{$KUBE.API.SERVER.URL} = https://<apiserver ip>:6443/metrics - It’s also fine to set the
kube.kubelet.urladdress to the master node’s IP.
7) Zabbix UI example inputs
- Example hostnames: Prod K8S Cluster / Prod K8S NODE
- Example IPs: api server ip –
198.51.100.24(master node) / kubelet ip –198.51.100.25(Node IP where the Zabbix pod is deployed)
- Prod K8S Cluster templates → cluster state / api server / controller manager / scheduler
2. Prod K8S Cluster → set macros
3. Prod K8S Node Templates → node/kubelet templates
4. Prod K8S Node → set macros
8) Checklist
- On deployed nodes, host agent2 is fully stopped
- Server ↔ Agent2 traffic allowed (10050/10051 as appropriate)
{$KUBE.API.TOKEN}is valid and has get/list/watch permissions{$KUBE.KUBELET.URL}(nodeIP:10250) is reachable- Separate Host A (cluster) and Host B (nodes); keep this principle when adding more templates
- Repo/chart/template versions match your Zabbix server version
- Zabbix Proxy Performance Limits
– Zabbix Proxy performance is directly tied to its internal DB I/O capacity,
which defines how many values it can process per second
(VPS: Values Per Second).
– In practice, a single proxy starts to hit its limit around ~250 VPS.
Once the load goes beyond that point, you should either increase proxy
resources or split the load across multiple proxies (Proxy A/B scaling).
– Even if the VPS is under 250, if the Pod’s resources—especially the CPU
limits—are set too low,
the Proxy can hit a processing bottleneck and experience data collection
delays.
| VPS Level | Status | Meaning |
|---|
| ≤ 250 | Stable | No special action required. |
| 250 ~ 350 | Warning Zone | Possible data delays — consider tuning or adding resources. |
| ≥ 350 | Risk Zone | High chance of data queue buildup → Proxy splitting recommended. |
In short, running everything through one proxy doesn’t scale well at higher collection rates.
Load distribution across multiple proxies is the clean and reliable solution.
If needed, I can provide a more in-depth guide on VPS estimation, tuning steps, and proxy scaling strategies.
9) FAQ
- Why place the Zabbix server outside the Kubernetes cluster?
On-prem, it’s not a hard requirement—but because the cluster itself is the monitoring target, running the Zabbix server outside the target cluster is generally cleaner. You can still monitor the cluster’s control plane, nodes, and workloads without circular dependencies, and you avoid losing your monitoring backend if the cluster has a control-plane outage.
Related Post : Dashboard
Related Article: Proxy Pod Deployment on Tainted Nodes
🛠 마지막 수정일: 2025.12.19
ⓒ 2025 엉뚱한 녀석의 블로그 [quirky guy's Blog]. All rights reserved. Unauthorized copying or redistribution of the text and images is prohibited. When sharing, please include the original source link.
💡 도움이 필요하신가요?
Zabbix, Kubernetes, 그리고 다양한 오픈소스 인프라 환경에 대한 구축, 운영, 최적화, 장애 분석,
광고 및 협업 제안이 필요하다면 언제든 편하게 연락 주세요.
📧 Contact: jikimy75@gmail.com
💼 Service: 구축 대행 | 성능 튜닝 | 장애 분석 컨설팅
📖 E-BooK [PDF] 전자책 (Gumroad):
Zabbix 엔터프라이즈 최적화 핸드북
블로그에서 다룬 Zabbix 관련 글들을 기반으로 실무 중심의 지침서로 재구성했습니다.
운영 환경에서 바로 적용할 수 있는 최적화·트러블슈팅 노하우까지 모두 포함되어 있습니다.
💡 Need Professional Support?
If you need deployment, optimization, or troubleshooting support for Zabbix, Kubernetes,
or any other open-source infrastructure in your production environment, or if you are interested in
sponsorships, ads, or technical collaboration, feel free to contact me anytime.
📧 Email: jikimy75@gmail.com
💼 Services: Deployment Support | Performance Tuning | Incident Analysis Consulting
📖 PDF eBook (Gumroad):
Zabbix Enterprise Optimization Handbook
A single, production-ready PDF that compiles my in-depth Zabbix and Kubernetes monitoring guides.
답글 남기기
댓글을 달기 위해서는 로그인해야합니다.