Ready to streamline your complex Zabbix operations?
I’ve distilled the most valuable insights from this blog into one essential guide. Take full control of your environment with the Zabbix 7 Enterprise Optimization Handbook [Mastering Hybrid Infrastructure Monitoring with a Kubernetes First Approach].
👉 Get your PDF copy here: https://jikimy.gumroad.com/l/zabbixmaster
🧭 Looking for related posts? Search for “An Examination of Monitoring Metrics” in the search bar.
In production environments, MySQL is more than just a relational database — it serves as the core data store and the foundation of service stability for countless applications.
Therefore, closely monitoring MySQL servers and query performance is essential for preventing failures and ensuring optimal performance.
Reading MySQL Performance with Zabbix
(Summary)
- If several panels spike at the same timestamp, it’s usually batch/cron/report queries. The width and duration of the spike matter more than the height.
- When Threads_connected, DML, and Network all jump together, it’s likely application-level load.
- If Row lock waits rise together with Disk temporary tables, suspect missing indexes for sort/group operations plus write contention.
- Buffer pool hit ratio must be ≥ 99%. If it stays < 99%, investigate immediately.
1) InnoDB: Open Files
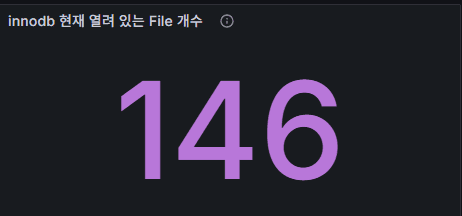
Meaning: Number of file handles InnoDB has opened (e.g., tablespaces).
Normal: Typically dozens to a few hundred; fine as long as it’s within innodb_open_files.
Red flag: Sudden surge with errors → check file-handle limits / OS ulimit.
Checks
SHOW VARIABLES LIKE 'innodb_open_files';
SHOW ENGINE INNODB STATUS\G
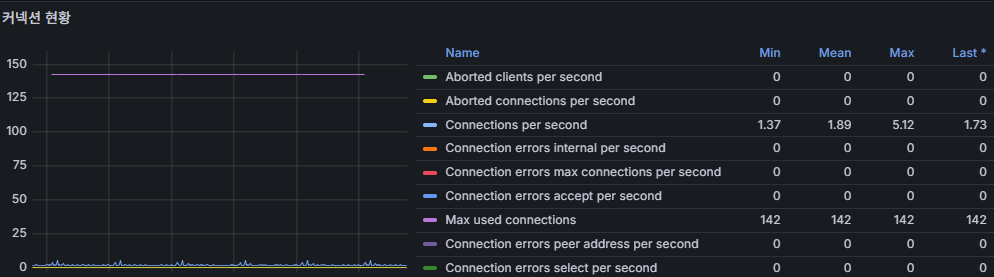
2) Connection Health (Aborted / Connections per second)
Meaning
- Aborted_clients / Aborted_connects: Client dropped socket vs. failed connections (auth, network, timeout).
- Connections/s: New connections per second. With pooling it’s smooth; without pooling it looks “toothed” (sawtooth).
Recommended thresholds
- Aborted_connects rising steadily (e.g., 5–10+/min continuously for 5 minutes) → check credentials/privileges/network/firewall/timeouts.
- Connections/s triples vs. baseline and Threads_connected rises too → likely pool miss / load spike.
Practical tips
- Re-confirm you’re actually using a pool (server/ORM).
- Overly large
wait_timeout/interactive_timeoutwastes connections.
Quick SQL
SHOW GLOBAL STATUS LIKE 'Aborted%';
SHOW GLOBAL STATUS LIKE 'Threads_connected';
3) Query Throughput (Queries/s vs Questions/s)
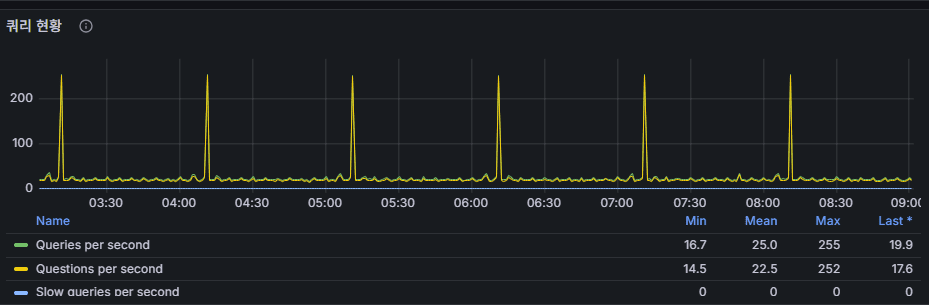
MeaningQueries and Questions differ slightly by version/definition; in practice they both indicate statements executed per second.
Pattern
Regular, clock-like peaks → batch workloads. (No slow queries observed in the screenshot context.)
Red flags
- Slow only at the peaks → tune batch queries / stagger schedules.
- Constantly high with latency/locks → check indexes, plans, schema.
Tuning points
- Create appropriate indexes for frequent
ORDER BY / GROUP BYcolumns. - Eliminate SELECT N+1 patterns.
4) MySQL Network Traffic (Bytes sent/received)
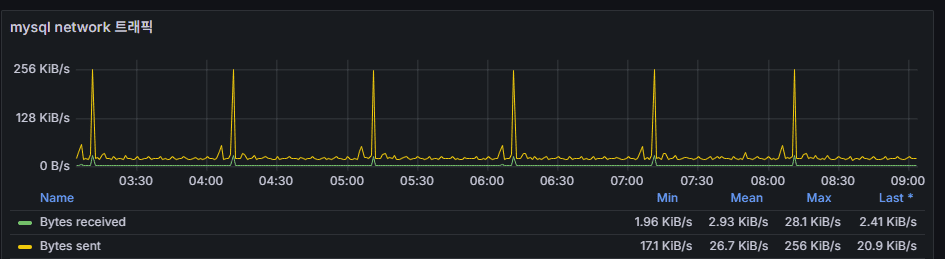
Meaning: DB-app I/O volume. Secondary to DML/SELECT peaks.
Reading: If it spikes in sync with DML/Queries, that correlation is normal.
Red flag: Network surges while queries stay flat → check bulk dump/backup/replication/health-check tools.
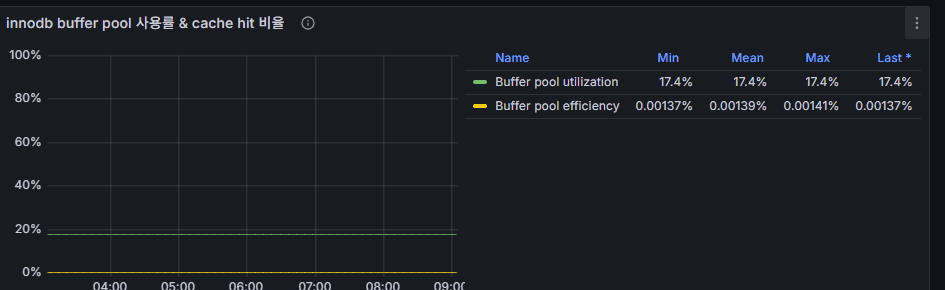
5) InnoDB Buffer Pool Utilization & Cache Hit
Meaning
- Buffer Pool Utilization: % of buffer pool memory currently in use.
- Buffer Pool Hit Ratio: How often reads are served from memory instead of disk. Normally ≥ 99%.
Observed notes
- Utilization around 12–13% → buffer pool is larger than the working set (not inherently bad; keep or shrink depending on memory headroom).
- A 0.03% “hit” readout is a display/calc mismatch: real hit rates should be ≥ 99%.
About the Zabbix template
In MySQL by agent2, the item can be misread as hit%, but the item expression actually computes a miss%. Lower is better in that expression.
- Option A: Rename the Grafana panel to “Buffer Pool Miss %”.
- Option B: If you want to keep “Hit %”, change the item formula.
Before (miss-rate formula as used by Zabbix item)
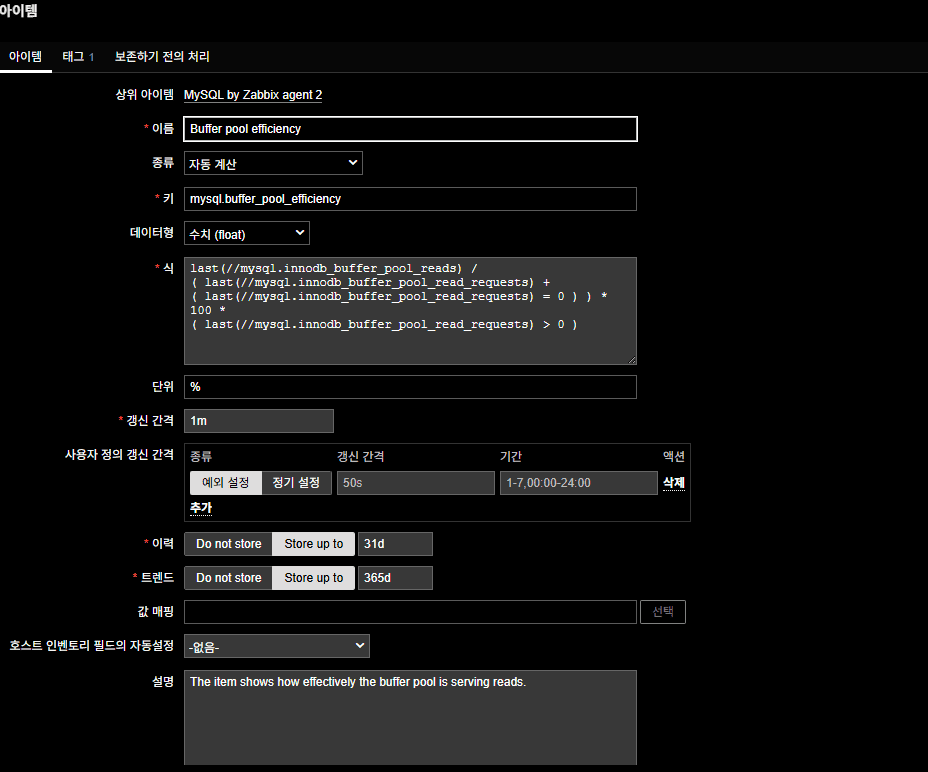
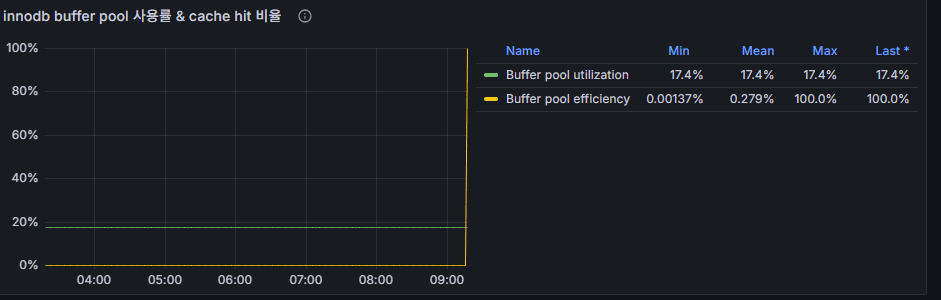
Corrected (to show Hit %) — graph expression
100 * (
  1 - last(//mysql.innodb_buffer_pool_reads) /
      ( last(//mysql.innodb_buffer_pool_read_requests)
        + ( last(//mysql.innodb_buffer_pool_read_requests) = 0 ) )
)
Red flag
- Hit% < 99% sustained → consider enlarging buffer pool (if RAM allows) and ensure hot set columns are indexed.
Verification SQL
SHOW GLOBAL STATUS LIKE 'Innodb_buffer_pool_read%';Buffer Pool Hit (%) — After Formula Correction
6) DML per Second (Insert/Update/Delete/Select)
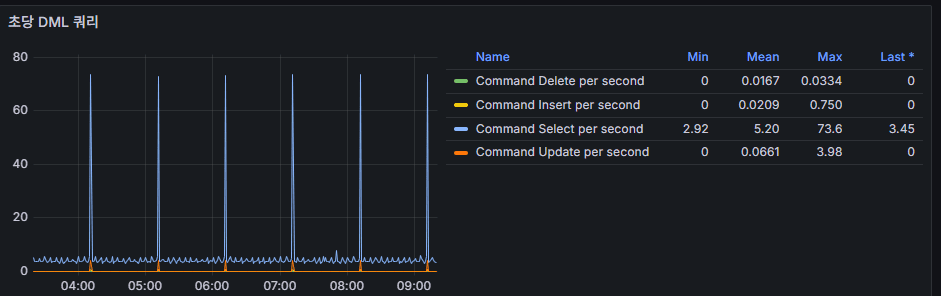
Meaning: Operation-type load profile.
Reading: Regular spikes on the hour/half → scheduled jobs.
Red flag: Brief but tall Update/Delete peaks with row-lock waits → record/range contention.
Tuning points
- Revisit indexes on frequently updated columns/filters.
- Break massive updates into smaller batches (shorter transactions).
- Consider partitioning/sharding.
7) Current Connections (Threads_connected)
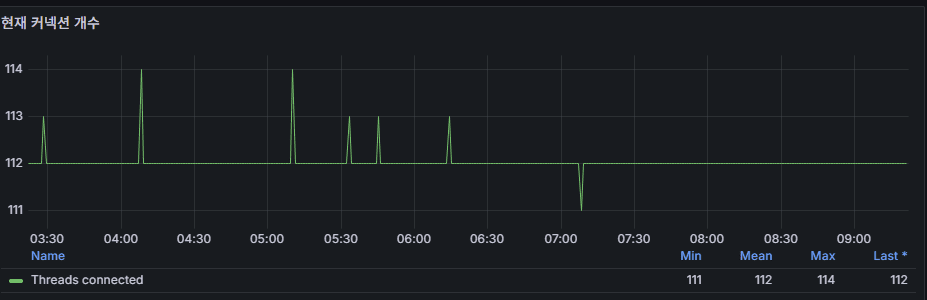
Meaning: Open connections right now.
Screenshot hint: ~111–114 steady → looks like a pool with persistent connections.
Red flags
- Threads_connected / max_connections > 0.8 for ≥ 5 min → risk of exhaustion.
- max_used_connections often near max_connections → revisit pool size / query latency / timeouts.
Quick SQL
SHOW VARIABLES LIKE 'max_connections';
SHOW GLOBAL STATUS LIKE 'Max_used_connections';
8) InnoDB Row Lock Waits
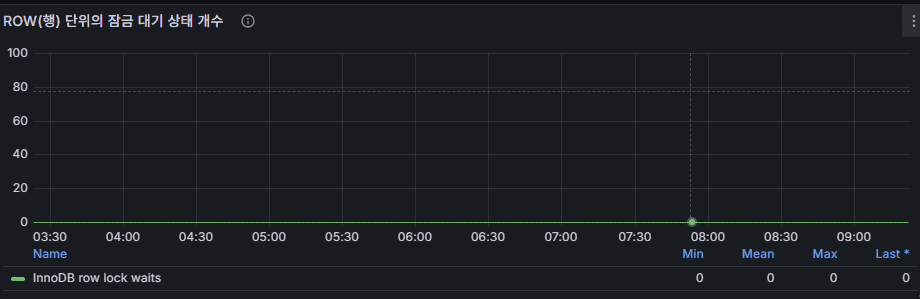
Meaning: Count of waits on record locks.
Good: Near zero or rare spikes.
Red flag: Surges aligned with DML spikes → hot key/range contention.
Response
- Proper indexes on contended keys.
- Split long transactions.
- Consider isolation level (e.g., READ COMMITTED) if appropriate.
Find conflicting sessions (Performance Schema)
SELECT * FROM performance_schema.data_locks\G
9) Temporary Tables per Second (especially disk temp tables)
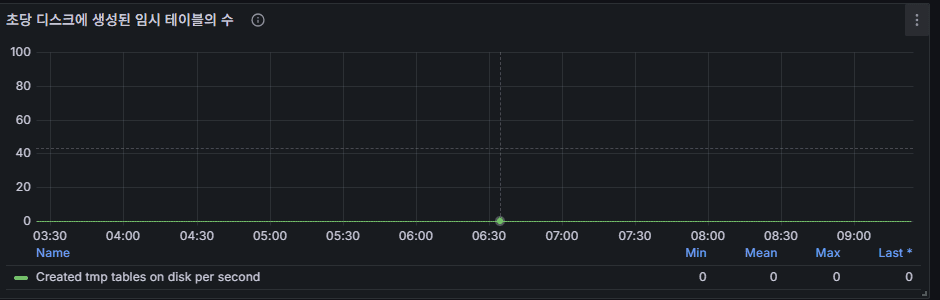
Meaning: When sorts/groups/joins overflow in-memory temp tables, disk temp tables are created.
Pattern: Regular spikes (~10) → batch aggregations/sorts.
Red flags
- Constantly high disk temp table creation (tens–hundreds/sec) → latency & I/O inflation.
Tuning points
- Raise
tmp_table_sizeandmax_heap_table_sizeto the same value (subject to RAM). - Index
GROUP BY / ORDER BYcolumns. TEXT/BLOBoften spill to disk → reconsider schema/query.
Checks
SHOW GLOBAL STATUS LIKE 'Created_tmp%';
SHOW VARIABLES LIKE 'tmp_table_size';
SHOW VARIABLES LIKE 'max_heap_table_size';
10) Additional “Temp on Disk” Indicators
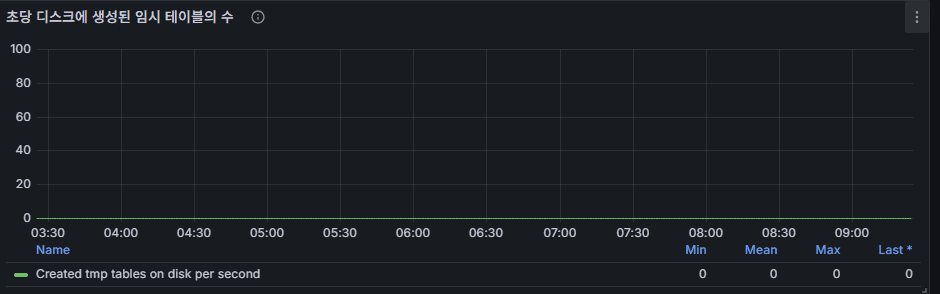
Meaning: Supporting metrics for #9.
Reading: If they jump together with DML/Queries, SELECT sort/aggregation is the likely cause.
Response: Same as #9.
When You See Anomalies
First, see which panels spike together.
- DML↑, Network↑, Threads_connected↑ → app load spike.
- Disk tmp tables↑, Row lock waits↑ → index/query design problem.
Find the culprit
Top cost statements:
SELECT DIGEST_TEXT, COUNT_STAR, SUM_TIMER_WAIT, SUM_LOCK_TIME
FROM performance_schema.events_statements_summary_by_digest
ORDER BY SUM_TIMER_WAIT DESC
LIMIT 20;
Also inspect the slow query log.
Then apply indexing/parameter tuning as indicated.
Zabbix Trigger Guideline (Examples)
Adjust thresholds to your environment; use with built-in template triggers.
- Buffer pool hit < 99% for 5m → Warning
- Threads_connected / max_connections > 0.8 for 5m → High
- Created tmp tables on disk/s > 50 for 5m → Warning
- Row lock waits/s > 0 for 5m → Warning
- Aborted connects growth rate high (5-min moving average over threshold) → Warning
Key Point
On high-traffic sites, I prioritize InnoDB buffer usage together with disk I/O:
MySQL isn’t an in-memory DB; InnoDB only caches data in the buffer pool. Once disk I/O rises, you must tune the DB. When dirty pages (buffered data updated in memory) accumulate, they must be flushed to disk—these flushes also drive disk I/O and are therefore critical metrics for performance monitoring.
🛠 마지막 수정일: 2025.12.22
ⓒ 2025 엉뚱한 녀석의 블로그 [quirky guy's Blog]. All rights reserved. Unauthorized copying or redistribution of the text and images is prohibited. When sharing, please include the original source link.
💡 도움이 필요하신가요?
Zabbix, Kubernetes, 그리고 다양한 오픈소스 인프라 환경에 대한 구축, 운영, 최적화, 장애 분석,
광고 및 협업 제안이 필요하다면 언제든 편하게 연락 주세요.
📧 Contact: jikimy75@gmail.com
💼 Service: 구축 대행 | 성능 튜닝 | 장애 분석 컨설팅
📖 E-BooK [PDF] 전자책 (Gumroad):
Zabbix 엔터프라이즈 최적화 핸드북
블로그에서 다룬 Zabbix 관련 글들을 기반으로 실무 중심의 지침서로 재구성했습니다.
운영 환경에서 바로 적용할 수 있는 최적화·트러블슈팅 노하우까지 모두 포함되어 있습니다.
💡 Need Professional Support?
If you need deployment, optimization, or troubleshooting support for Zabbix, Kubernetes,
or any other open-source infrastructure in your production environment, or if you are interested in
sponsorships, ads, or technical collaboration, feel free to contact me anytime.
📧 Email: jikimy75@gmail.com
💼 Services: Deployment Support | Performance Tuning | Incident Analysis Consulting
📖 PDF eBook (Gumroad):
Zabbix Enterprise Optimization Handbook
A single, production-ready PDF that compiles my in-depth Zabbix and Kubernetes monitoring guides.
답글 남기기
댓글을 달기 위해서는 로그인해야합니다.