Ready to streamline your complex Zabbix operations?
I’ve distilled the most valuable insights from this blog into one essential guide. Take full control of your environment with the Zabbix 7 Enterprise Optimization Handbook [Mastering Hybrid Infrastructure Monitoring with a Kubernetes First Approach].
👉 Get your PDF copy here: https://jikimy.gumroad.com/l/zabbixmaster
🧭 Looking for related posts? Search for “An Examination of Monitoring Metrics” in the search bar.
MongoDB is more than a simple document database. It is widely used as a session store, log analytics engine, and even a messaging backbone.
To ensure stable operations, monitoring must cover availability, performance, resources, cursors & connections, and network usage.
The following are the core metrics that should always be part of a MongoDB monitoring strategy.
1. Availability Metrics
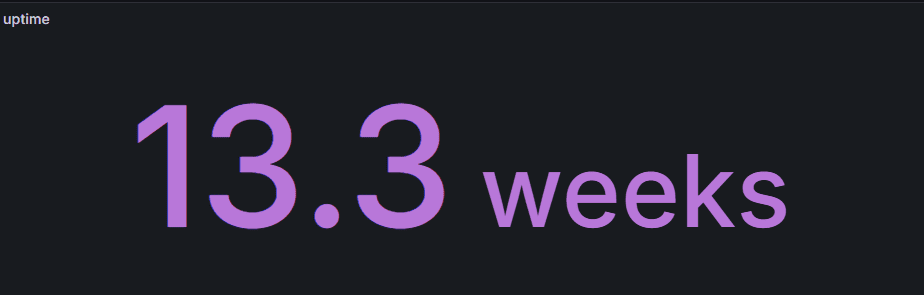
uptime
- Total time the MongoDB process has been running.
- A long uptime suggests stability, while frequent restarts often indicate underlying issues or configuration problems.
- Always review restart patterns together with logs.
2. Performance Metrics
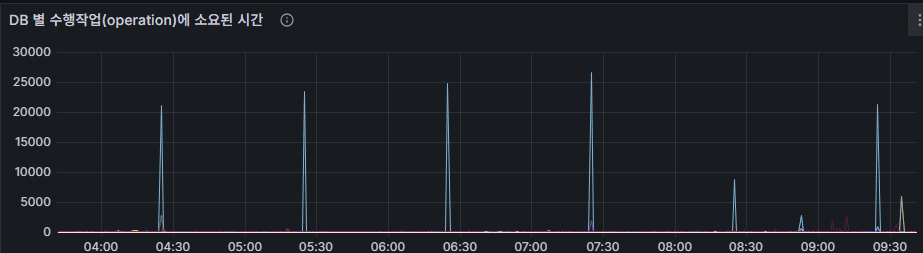
operation latency (total)
- Average time (ms) required for all operations (insert, update, query, delete, command).
- Stable, low latency is normal.
- Sudden increases usually point to missing indexes, disk I/O bottlenecks, or lock contention.
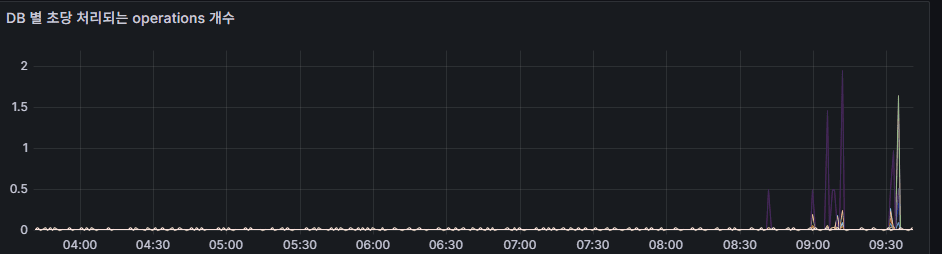
operation throughput (rate)
- Number of operations executed per second (ops/sec).
- Useful for identifying workload patterns.
- Sharp spikes or drops may indicate abnormal traffic or application errors.
3. Resource Metrics
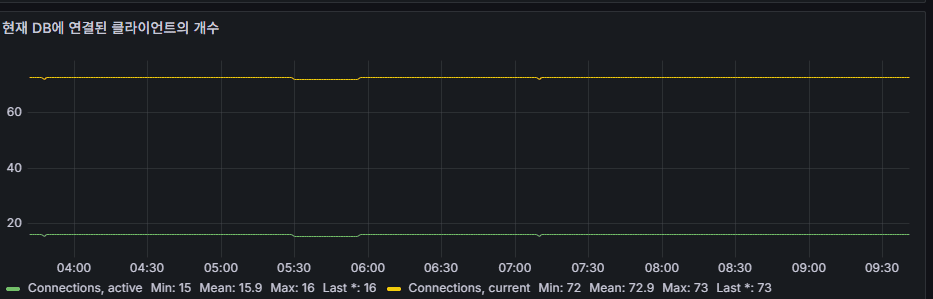
connections
- Number of client connections to MongoDB.
- If connection pool limits are reached, new connections may fail. Monitoring trends is critical.
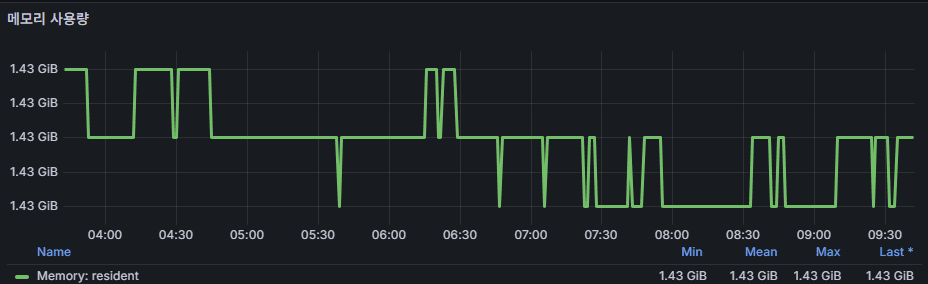
memory usage (resident memory)
- Physical memory consumed by the process.
- MongoDB relies on keeping the working set in memory for performance.
- If memory runs low, page faults and OS swapping occur, leading to severe latency.
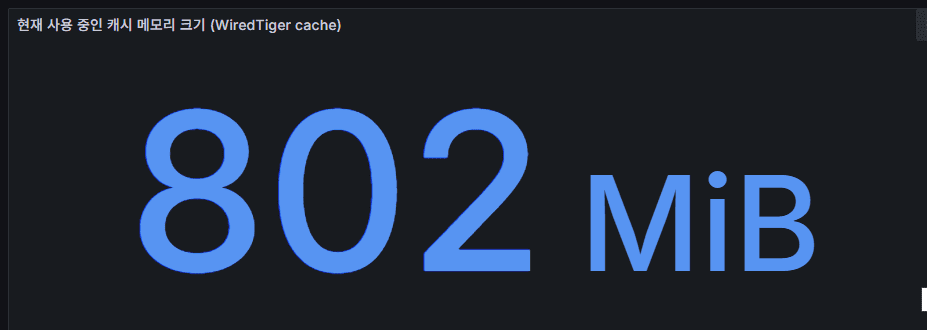
wiredTiger cache
- The internal cache used by the WiredTiger storage engine to minimize disk access.
- Frequently accessed pages are kept in memory.
- Flow: document → in-memory cache → disk sync. When the cache is full, eviction occurs (old pages written to disk, new pages loaded).
- Sustained high cache usage leads to frequent evictions, increased disk I/O, and potential performance degradation.
- Cache size and utilization are among the most critical metrics for MongoDB performance monitoring.
4. Cursor & Client Metrics
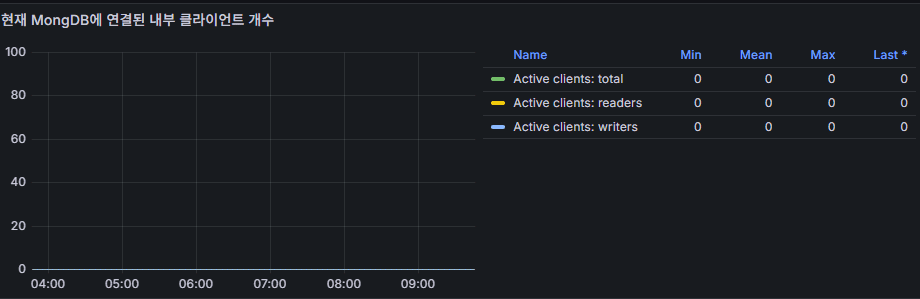
active clients
- Number of clients currently performing read/write operations.
- Sudden surges typically point to batch jobs or query hotspots.
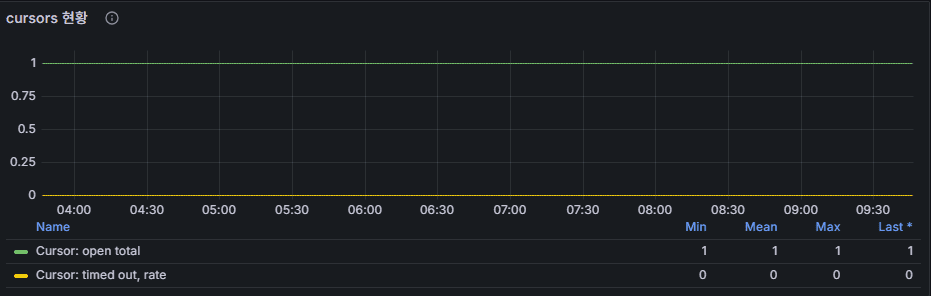
cursors
- A cursor is created whenever a query is executed to traverse the result set.
- Flow: query execution → cursor opened → client fetches data → cursor closed when results are fully consumed or timeout expires.
- If cursors remain open for long periods, memory is wasted. If timeouts accumulate, it indicates the application is not consuming results properly.
- In practice, dashboards often show
cursor = 1constantly.- Normal: long-lived cursors used by change streams or tailable cursors (e.g., oplog tailing).
- Abnormal: a standard query that never closes → application code should be reviewed.
- A single open cursor does not pose a risk by itself, but understanding why it remains open is important.
- Cursor metrics are valuable for diagnosing query patterns beyond raw performance numbers.
5. Network Metrics
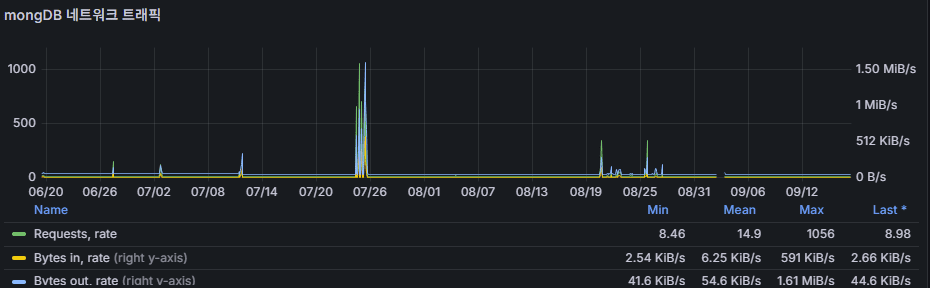
network traffic
- Amount of data sent and received (bytes/sec).
- Stable, predictable patterns are expected.
- Unusual increases often come from replication overhead, heavy query responses, or application spikes.
✅ Operational Takeaways
- Uptime → the primary indicator of process stability.
- Operation Latency + Throughput → key metrics for spotting performance bottlenecks.
- Connections + Memory + WiredTiger Cache → essential for detecting resource saturation.
- Cursors + Active Clients → highlight query behavior and potential inefficiencies.
- Network Traffic → provides insight into data flow and sudden load concentration.
🛠 마지막 수정일: 2025.12.22
ⓒ 2025 엉뚱한 녀석의 블로그 [quirky guy's Blog]. All rights reserved. Unauthorized copying or redistribution of the text and images is prohibited. When sharing, please include the original source link.
💡 도움이 필요하신가요?
Zabbix, Kubernetes, 그리고 다양한 오픈소스 인프라 환경에 대한 구축, 운영, 최적화, 장애 분석,
광고 및 협업 제안이 필요하다면 언제든 편하게 연락 주세요.
📧 Contact: jikimy75@gmail.com
💼 Service: 구축 대행 | 성능 튜닝 | 장애 분석 컨설팅
📖 E-BooK [PDF] 전자책 (Gumroad):
Zabbix 엔터프라이즈 최적화 핸드북
블로그에서 다룬 Zabbix 관련 글들을 기반으로 실무 중심의 지침서로 재구성했습니다.
운영 환경에서 바로 적용할 수 있는 최적화·트러블슈팅 노하우까지 모두 포함되어 있습니다.
💡 Need Professional Support?
If you need deployment, optimization, or troubleshooting support for Zabbix, Kubernetes,
or any other open-source infrastructure in your production environment, or if you are interested in
sponsorships, ads, or technical collaboration, feel free to contact me anytime.
📧 Email: jikimy75@gmail.com
💼 Services: Deployment Support | Performance Tuning | Incident Analysis Consulting
📖 PDF eBook (Gumroad):
Zabbix Enterprise Optimization Handbook
A single, production-ready PDF that compiles my in-depth Zabbix and Kubernetes monitoring guides.
답글 남기기
댓글을 달기 위해서는 로그인해야합니다.