(The Readiness Probe Trap) #
In K8S, you should never feel safe just because kubectl get pods shows a Pod as Running.
That only means “the container exists and is running”, not “it is ready to receive traffic.”
Symptom: Look for Running (0/1) #
The first thing to check is the READY column.
kubectl get pods -n <namespace>NAME READY STATUS RESTARTS
app-pod 0/1 Running 0If the STATUS is Running but READY is 0/1?
That means the container is running, but Kubernetes has decided “this thing is not ready yet” and has removed it from the Service endpoints.
Naturally, you won’t be able to connect.
Finding the Cause: describe and debug #
To see why the Pod is not ready, check the events with describe.
kubectl describe pod <pod-name> -n <namespace>If you see “Readiness probe failed” in the Events section, that’s your answer.
If you want to inspect the internal state of the app but the image has no sh, ps, or other basic tools (for example, a Distroless image), attach a temporary debug container like this.
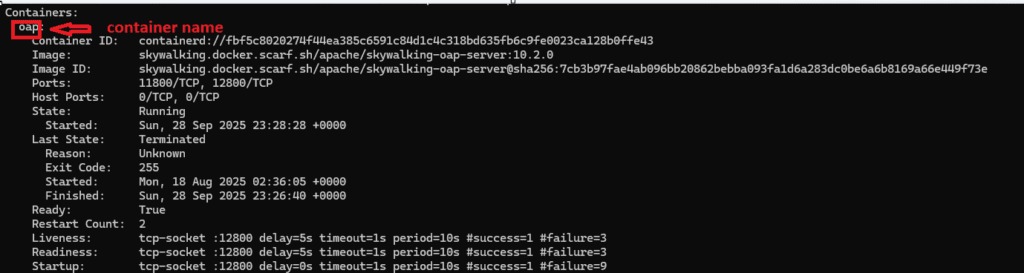
To run the debug command, you need the container name.
You can find the container name from the describe output above.
kubectl debug -it <pod-name> -n <namespace> \
  --image=nicolaka/netshoot --target=<container-name>
After attaching:
ss -lntp # Check whether the app is actually listening on the port and bound to 0.0.0.0You can also inspect process and network state using commands like:
ps, curl, ip a, ip route, ip neigh,
nslookup, dig, printenv, df -h,
free -m, getent hosts
Distroless images contain only the application binary and its runtime dependencies.
Shells and basic utilities are intentionally removed.
This improves security, but for troubleshooting,kubectl debugbecomes essential.
Fix: Adjust the Probe Configuration #
In most cases, this happens because the application startup time is longer than the probe configuration allows.
Increase initialDelaySeconds or fix the health check path.
First, find which controller created the Pod:
kubectl get pod <pod-name> -n <namespace> \
  -o jsonpath='{.metadata.ownerReferences[0].kind}{" "}{.metadata.ownerReferences[0].name}{"\n"}'
This usually returns a ReplicaSet, and in most cases the original source is a Deployment.
(It could be a StatefulSet, but we’ll assume a Deployment here.)
Trace ReplicaSet → Deployment:
kubectl get rs -n <namespace> | grep <replicaset-name>Edit the resulting Deployment:
kubectl edit deploy <deploy-name> -n <namespace>Example:
readinessProbe:
  httpGet:
    path: /healthz
    port: 8080
  initialDelaySeconds: 30  # Give the application enough time to start
Summary #
- Check whether the Pod shows
0/1inkubectl get pods - Use
describeto confirmReadiness probe failed - Adjust
initialDelaySecondsbased on application startup time - Running describes the container state, not the service readiness
🛠 마지막 수정일: 2025.12.22
💡 도움이 필요하신가요?
Zabbix, Kubernetes, 그리고 다양한 오픈소스 인프라 환경에 대한 구축, 운영, 최적화, 장애 분석,
광고 및 협업 제안이 필요하다면 언제든 편하게 연락 주세요.
📧 Contact: jikimy75@gmail.com
💼 Service: 구축 대행 | 성능 튜닝 | 장애 분석 컨설팅
📖 E-BooK [PDF] 전자책 (Gumroad):
Zabbix 엔터프라이즈 최적화 핸드북
블로그에서 다룬 Zabbix 관련 글들을 기반으로 실무 중심의 지침서로 재구성했습니다.
운영 환경에서 바로 적용할 수 있는 최적화·트러블슈팅 노하우까지 모두 포함되어 있습니다.
💡 Need Professional Support?
If you need deployment, optimization, or troubleshooting support for Zabbix, Kubernetes,
or any other open-source infrastructure in your production environment, or if you are interested in
sponsorships, ads, or technical collaboration, feel free to contact me anytime.
📧 Email: jikimy75@gmail.com
💼 Services: Deployment Support | Performance Tuning | Incident Analysis Consulting
📖 PDF eBook (Gumroad):
Zabbix Enterprise Optimization Handbook
A single, production-ready PDF that compiles my in-depth Zabbix and Kubernetes monitoring guides.


