Ready to streamline your complex Zabbix operations?
I’ve distilled the most valuable insights from this blog into one essential guide. Take full control of your environment with the Zabbix 7 Enterprise Optimization Handbook [Mastering Hybrid Infrastructure Monitoring with a Kubernetes First Approach].
👉 Get your PDF copy here: https://jikimy.gumroad.com/l/zabbixmaster
🧭 Looking for related posts? Search for “An Examination of Monitoring Metrics” in the search bar.
1. Cluster Health Metrics
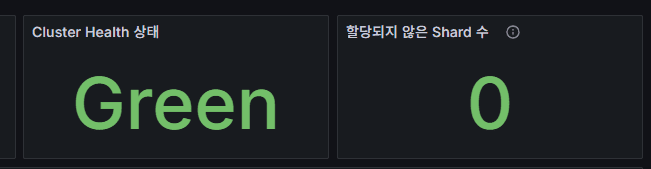
cluster health
Overall cluster status.
- Green = healthy
- Yellow = replica shards unassigned
- Red = risk of data loss
unassigned shards
Number of shards not assigned to any node.
- Normal value: 0
- Increases when disk space is low, a node goes down, or shard relocation is delayed
2. Resource Metrics

Total size of all file stores / Total available size to JVM in all file stores
- Total = physical disk capacity across all data paths
- Available = actual usable space as reported to the JVM (excludes filesystem reservations/quotas)
- Used to determine whether new shards can be allocated
⚠️ Problem points when Available decreases rapidly
- Caused by index growth, log bursts, or replica expansion
- Watermark thresholds (default values):
- 85% used → no new shard allocations
- 90% used → existing shards relocated away from the node
- 95% used → affected indices switched to read-only
Summary
- Looking only at Total can be misleading; Available is often much smaller.
- Total size = raw physical capacity.
- Total available to JVM = what Elasticsearch can actually use.
- Not related to JVM Heap; reflects only filesystem availability.
- Always monitor Available for real operational decisions.
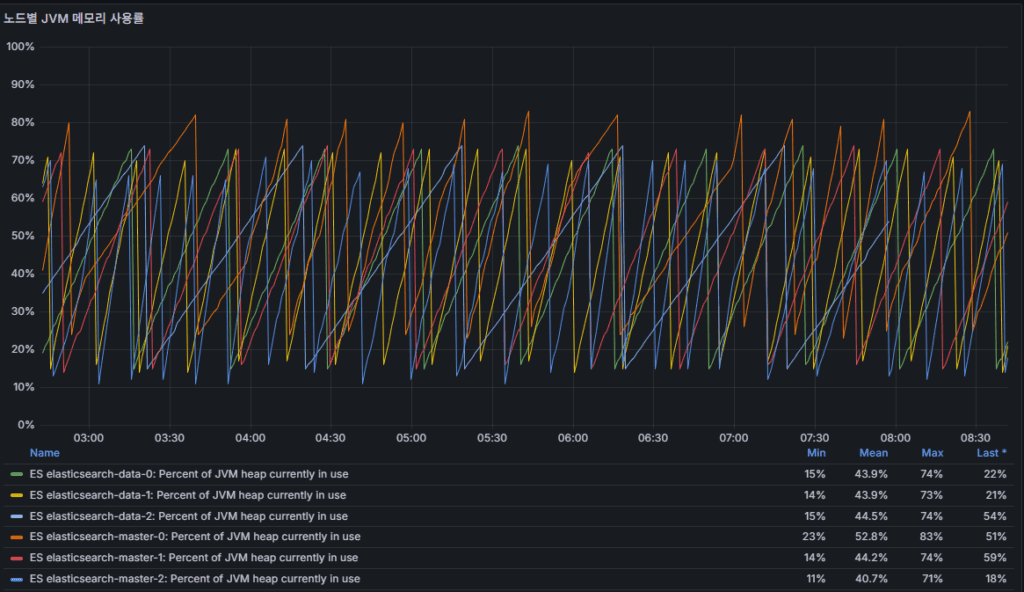
jvm_heap_usage_percent
- JVM Heap utilization.
- Sustained 85%+ → Full GC frequency increases, higher risk of latency.
- 95%+ → OutOfMemoryError becomes likely.
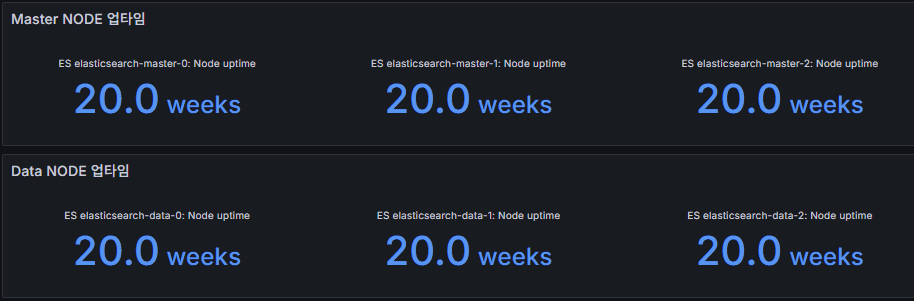
node uptime
- Node runtime duration.
- Frequent restarts are an early sign of instability.
3. Performance Metrics
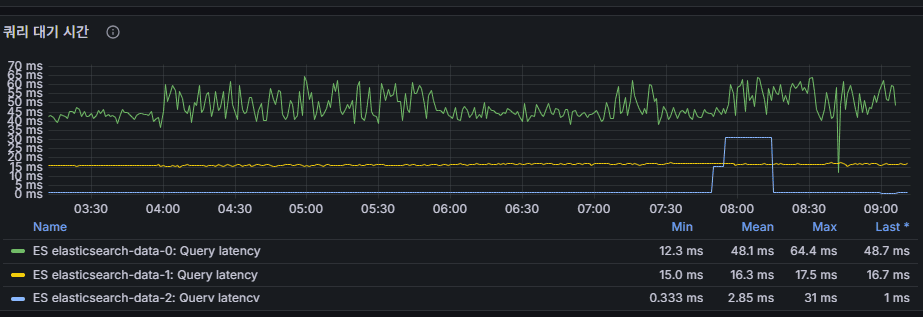
query latency
Search query response time.
- Rising latency in milliseconds signals degraded user experience.
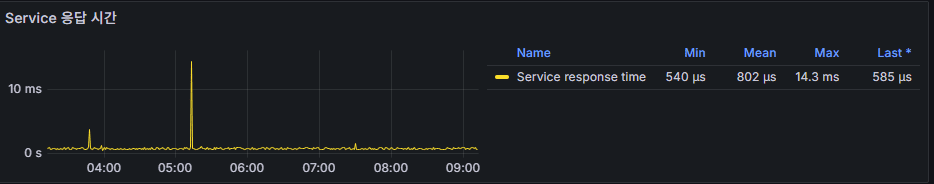
service response_time
REST API response time.
- Persistent increases indicate backend resource bottlenecks.
4. Indexing & Connection Metrics
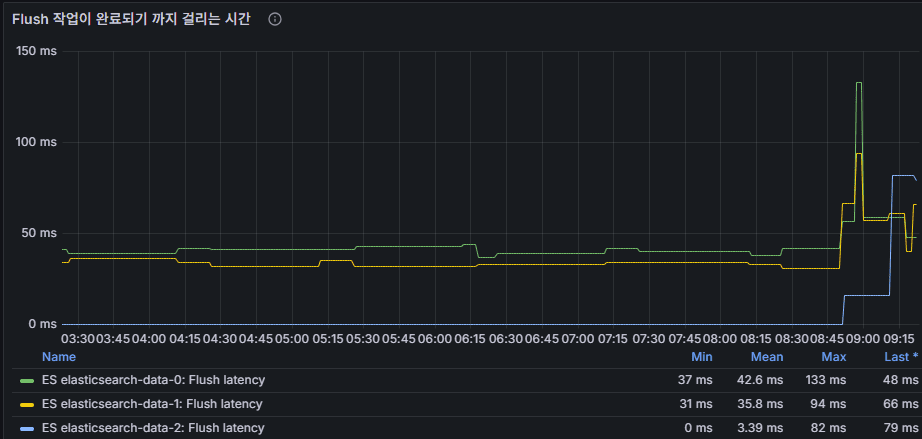
flush latency
Time required to complete a flush operation.
- Indicates disk I/O bottlenecks.
Indexing flow:
- Document → in-memory buffer → segment write (recorded in translog)
- Refresh → buffer promoted to segment, searchable
- Flush → translog safely persisted to disk and segment committed
Operational meaning:
- Higher flush latency → slower disk I/O, larger translogs,
and longer recovery times during failures
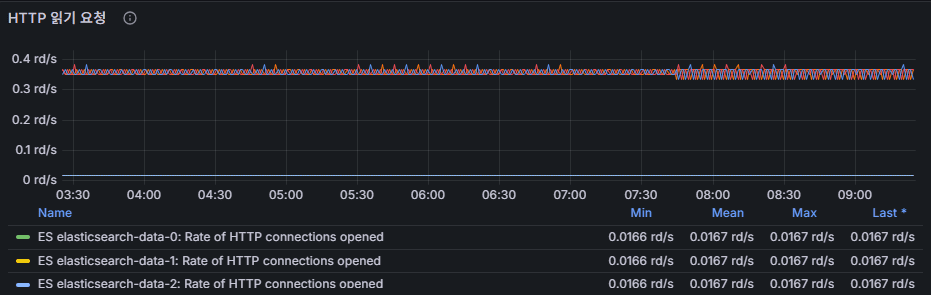
http connections opened
Number of open HTTP connections.
- Spikes may suggest client-side load surges or connection pooling issues.
✅ Operational Takeaways
- Cluster Health + unassigned shards → the first and most critical stability check
- Disk usage (Available) + JVM Heap → best indicators of capacity risks
- Query Latency + Response Time → primary bottleneck detectors
- Flush Latency + HTTP Connections → highlight data processing delays and client load pressure
🛠 마지막 수정일: 2025.12.22
ⓒ 2025 엉뚱한 녀석의 블로그 [quirky guy's Blog]. All rights reserved. Unauthorized copying or redistribution of the text and images is prohibited. When sharing, please include the original source link.
💡 도움이 필요하신가요?
Zabbix, Kubernetes, 그리고 다양한 오픈소스 인프라 환경에 대한 구축, 운영, 최적화, 장애 분석,
광고 및 협업 제안이 필요하다면 언제든 편하게 연락 주세요.
📧 Contact: jikimy75@gmail.com
💼 Service: 구축 대행 | 성능 튜닝 | 장애 분석 컨설팅
📖 E-BooK [PDF] 전자책 (Gumroad):
Zabbix 엔터프라이즈 최적화 핸드북
블로그에서 다룬 Zabbix 관련 글들을 기반으로 실무 중심의 지침서로 재구성했습니다.
운영 환경에서 바로 적용할 수 있는 최적화·트러블슈팅 노하우까지 모두 포함되어 있습니다.
💡 Need Professional Support?
If you need deployment, optimization, or troubleshooting support for Zabbix, Kubernetes,
or any other open-source infrastructure in your production environment, or if you are interested in
sponsorships, ads, or technical collaboration, feel free to contact me anytime.
📧 Email: jikimy75@gmail.com
💼 Services: Deployment Support | Performance Tuning | Incident Analysis Consulting
📖 PDF eBook (Gumroad):
Zabbix Enterprise Optimization Handbook
A single, production-ready PDF that compiles my in-depth Zabbix and Kubernetes monitoring guides.
답글 남기기
댓글을 달기 위해서는 로그인해야합니다.