📘 Overview
After completing the Zabbix integration, it’s time to move on to the dashboard design phase.
This guide goes beyond simply importing templates — it walks through how to create a practical Grafana dashboard that allows operators to interpret and correlate key metrics such as CPU, memory, disk, and network performance.
A dashboard isn’t just a collection of graphs — it’s an operational map that visually guides you on where to start investigating when a problem occurs.
1. Create Folders and Dashboards
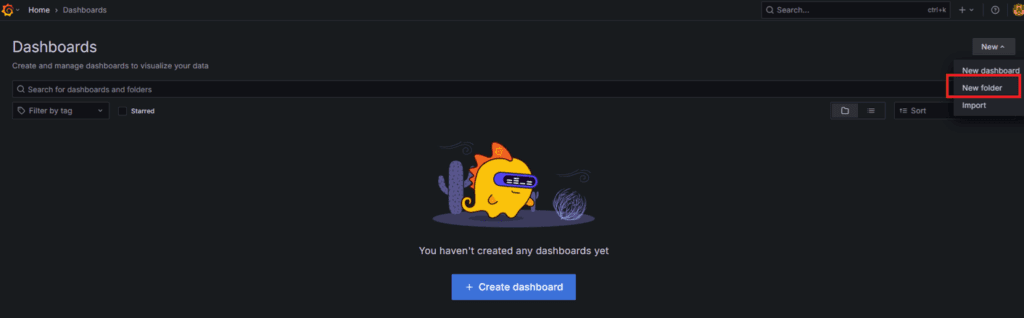
1.1 Creating a Folder (Optional)
When managing multiple server groups or metric sets, using folders helps keep your dashboards organized.
Menu → Dashboards → New → New folder
→ Example name: example → Create
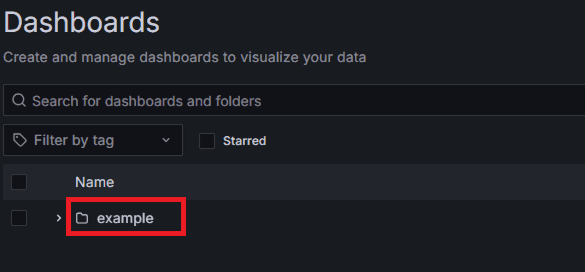
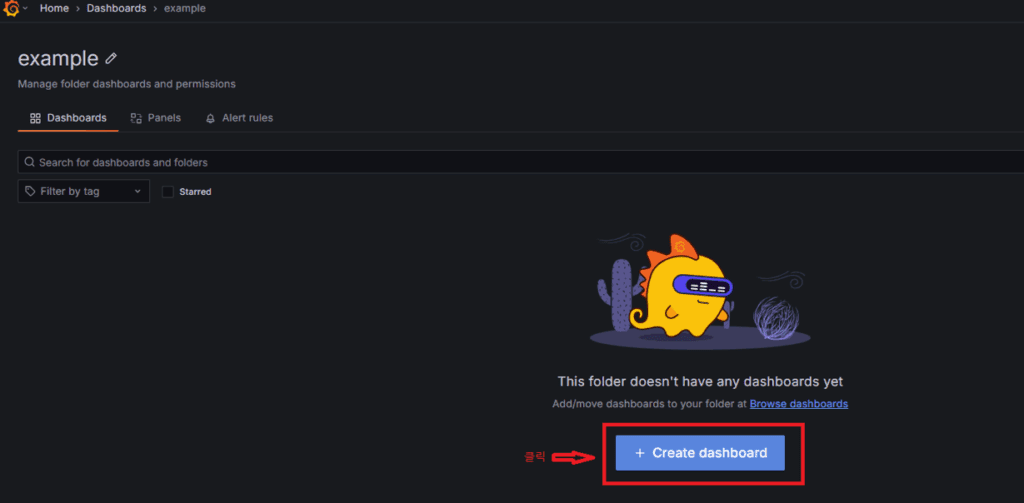
1.2 Creating a Dashboard
Inside the folder, create a new dashboard.
Menu → Dashboards → example → New dashboard → Add visualization
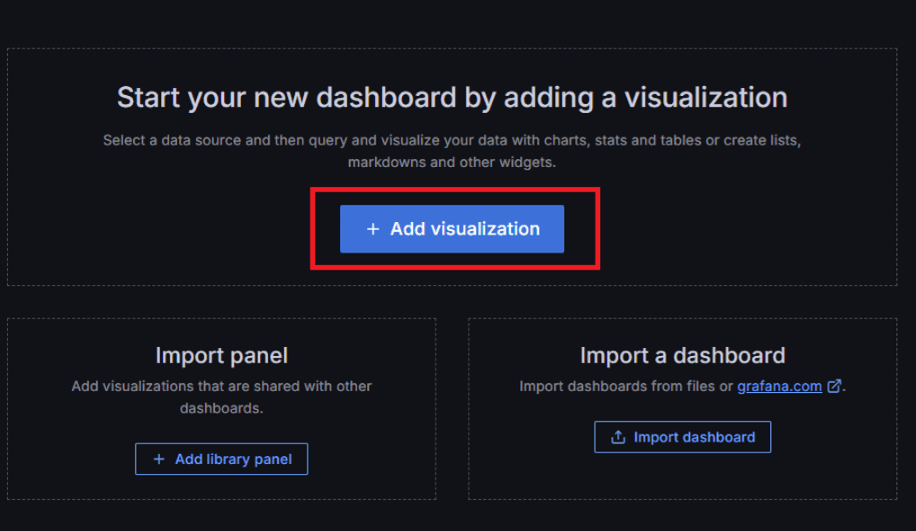
2. First Panel: CPU Utilization
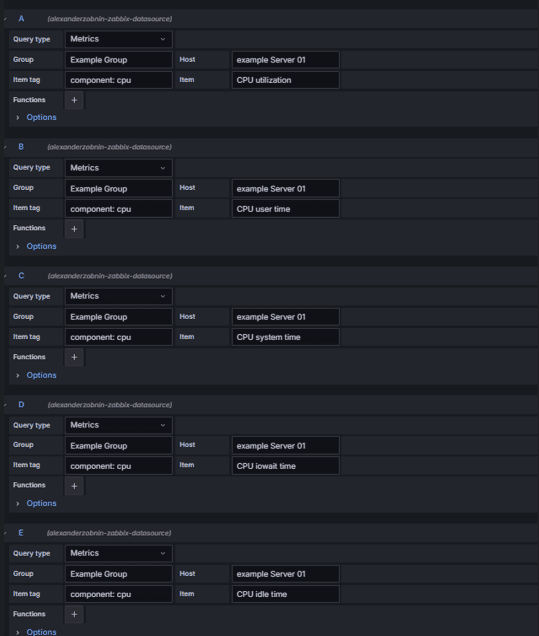
2.1 Basic Query Settings
| Field | Configuration |
|---|---|
| Data source | Zabbix |
| Query Type | Metrics |
| Group | Select (e.g., Example Group) |
| Host | Select (e.g., example Server 01) |
| Item | CPU utilization / CPU user time / CPU system time / CPU iowait time / CPU idle time |
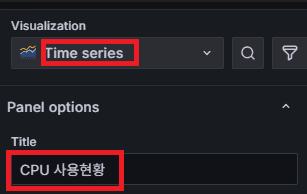
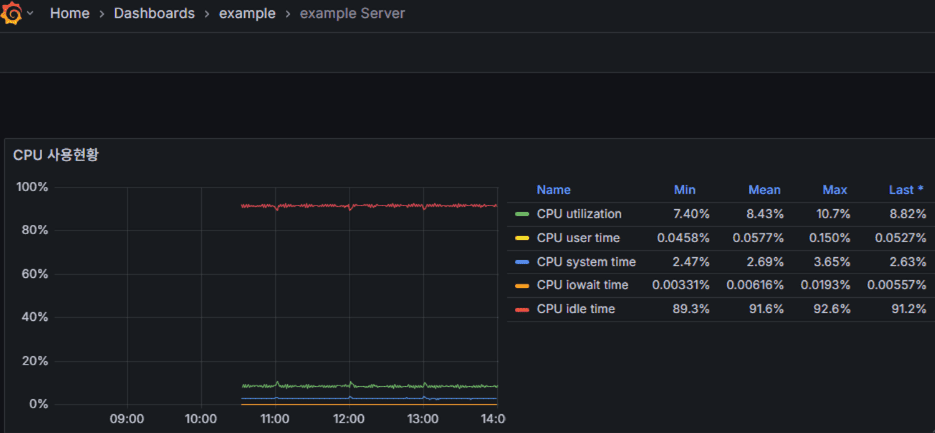
2.2 Visualization Options
| Option | Recommended Setting |
|---|---|
| Visualization | Time series |
| Title | CPU Usage Overview |
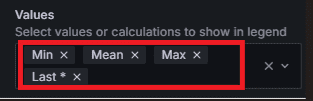
| Values | Mean / Max / Min |
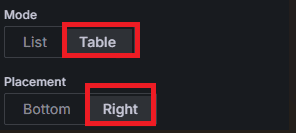
| Mode | Table (optional) |
| Placement | Right (optional) |
2.3 Why These Metrics Matter
| Metric | Operational Meaning |
|---|---|
| CPU utilization | Baseline for assessing overall system load |
| CPU user time | Indicates user-level process workload trends |
| CPU system time | Reflects kernel/system call ratio (rises during I/O load) |
| CPU iowait time | Detects potential disk I/O bottlenecks |
| CPU idle time | Shows remaining CPU capacity |
⚙️ Recommended additional metrics for advanced or virtualized environments
- CPU steal time → Detects hypervisor resource contention
- CPU nice time → Indicates low-priority process share
- CPU softirq time → Identifies network interrupt concentration
3. Choosing the Correct Value Function (Last vs. Last*)
Grafana’s Zabbix data often includes Null values.
To display data correctly, you must choose the proper “last value function.”
| Situation | Function | Description |
|---|---|---|
| Normal data collection | Last | Returns the most recent data point |
| Intermittent collection delay | Last* | Returns the last valid (non-null) value |
| To prevent graph breaks | Last* | Maintains visualization stability |
✅ In production, using Last* is recommended.
It preserves the last valid value even if data gaps occur, preventing visual interruptions.
4. Building Logical Relationships Between Metrics
A good dashboard doesn’t just list metrics — it shows the logical flow of investigation:
“Symptom → Cause analysis → Root cause.”
Example flow 👇
CPU panel → Detect performance issue
    ↓
Disk I/O panel → Check for bottlenecks
    ↓
Memory/Process panel → Identify resource culprits
    ↓
Network panel → Examine external influence
By structuring panels this way, operators can see the flow of system anomalies at a glance.
In other words, meaningful relationships matter more than the number of graphs.
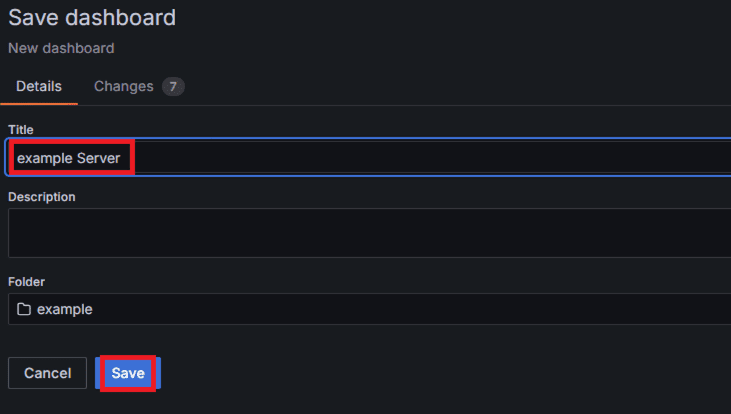
5. Saving the Dashboard
Once configuration is complete:
Save dashboard → Enter title → Save
📌 Example title: example server
You can later expand this same structure for Memory, Disk, and Network dashboards.
6. Verification & Validation
| Checkpoint | Validation Criteria |
|---|---|
| Data collection | Confirm real-time updates |
| Units | Ensure correct units (% or MB) |
| Null handling | Verify Last* is applied |
| Title consistency | Maintain a uniform naming convention |
7. Next Step
In the next part, we’ll use Grafana Variables to build dynamic dashboards — allowing flexible selection of Group, Host, and Item for interactive metric views.
🛠 마지막 수정일: 2025.11.10
ⓒ 2025 엉뚱한 녀석의 블로그 [quirky guy's Blog]. All rights reserved. Unauthorized copying or redistribution of the text and images is prohibited. When sharing, please include the original source link.
💡 도움이 필요하신가요?
Zabbix, Kubernetes, 그리고 다양한 오픈소스 인프라 환경에 대한 구축, 운영, 최적화, 장애 분석이 필요하다면 언제든 편하게 연락 주세요.
📧 Contact: jikimy75@gmail.com
💼 Service: 구축 대행 | 성능 튜닝 | 장애 분석 컨설팅
💡 Need Professional Support?
If you need deployment, optimization, or troubleshooting support for Zabbix, Kubernetes, or any other open-source infrastructure in your production environment, feel free to contact me anytime.
📧 Email: jikimy75@gmail.com
💼 Services: Deployment Support | Performance Tuning | Incident Analysis Consulting
답글 남기기
댓글을 달기 위해서는 로그인해야합니다.