📘 Overview
If you’ve completed the static dashboards for CPU, memory, and disk in Part 3,
this section will show how to extend them into dynamic, exploratory dashboards by using Grafana’s Variables feature.
By leveraging variables, you can:
- Filter servers by Zabbix group
- Compare specific hosts within multiple servers
- Switch metrics (e.g., CPU, Memory, I/O) in real time — all within a single view
1. Understanding Variables
Grafana variables act as dynamic placeholders that pass query values within a dashboard.
The Zabbix plugin supports variable query types such as Group, Host, and Item, allowing you to reuse the same panel across multiple hosts or metrics.
In other words, it enables you to create “one CPU usage panel that displays every server.”
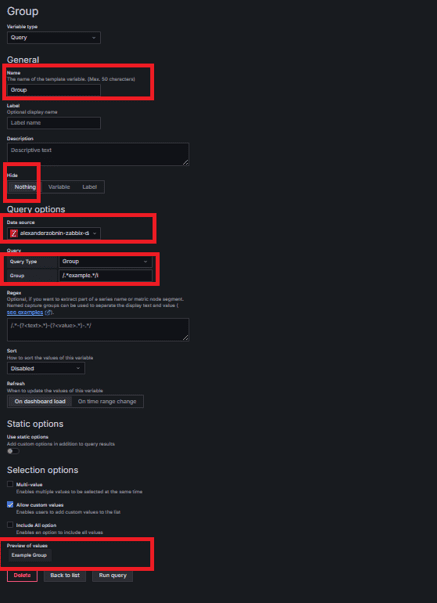
2. Setting up the Group Variable
2.1 Configuration Path
Dashboard → Settings (⚙️) → Variables → Add variable
(If the settings menu isn’t visible in the top-right corner, click Edit instead.)
2.2 Key Parameters
| Field | Value | Description |
|---|---|---|
| Name | Group | Variable name |
| Hide | Nothing | Displays variable name on screen (not hidden) |
| Query Type | Group | Retrieves Zabbix group list |
| Group : Regex Filter | /.*example.*/i | Filters only groups matching “example” |

💡 Multi-value and Include All option are not selected in this case,
since there’s only one example group. See the Host variable setup section below for details.
2.3 Save
Click Save dashboard →
If the Group dropdown appears at the top of the dashboard, it’s working correctly.
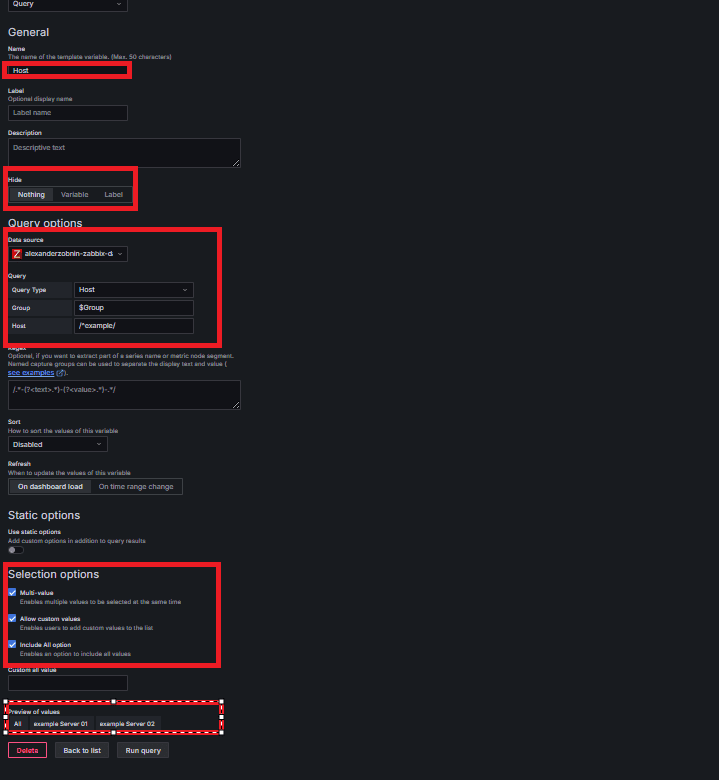
3. Setting up the Host Variable
3.1 Add a New Variable
Dashboard Settings → Variables → New variable
3.2 Configuration
| Field | Value | Description |
|---|---|---|
| Name | Host | Variable name |
| Query Type | Host | Retrieves hosts belonging to the selected group |
| Group | $Group | References the previously created Group variable |
| Host : Regex filter | /^example/ or /.*?/ | Filters specific hosts |
| Multi-value | ✅ Enabled | Allows selecting multiple hosts |
| Include All option | ✅ Enabled | Adds an “All” option |

⚙️ Multi-value is useful when managing three or more servers.
For instance, if there are multiple example servers, you can view only example server 01 and example server 02 without selecting “All.”
4. Setting up the Item Variable
4.1 Add a New Variable
Dashboard Settings → Variables → New variable
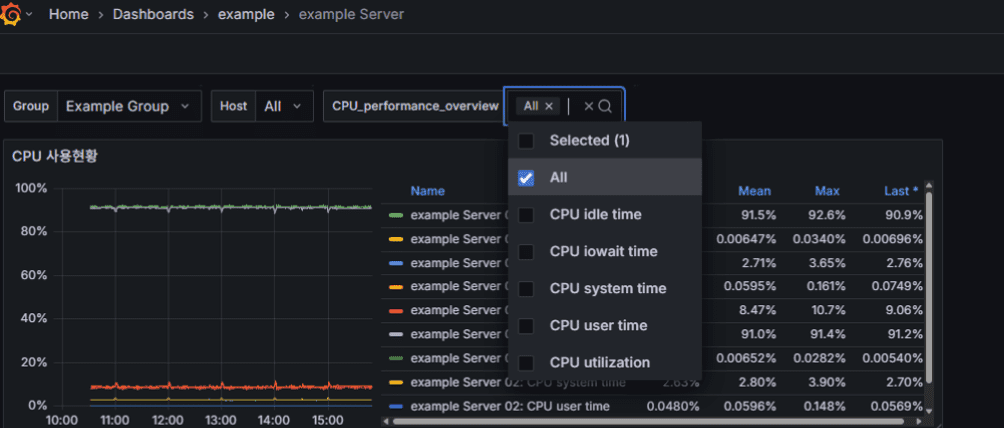
4.2 Configuration
| Field | Value | Description |
|---|---|---|
| Name | CPU_performance_overview | Variable name (Label name can also be specified if desired) |
| Query Type | Item | Retrieves Zabbix item list |
| Group | $Group | References the Group variable |
| Host | $Host | References the Host variable |
| Item : Regex filter | `/^CPU (utilization | user time |
| Multi-value | ✅ Enabled | Displays multiple metrics at once |
| Include All option | ✅ Enabled | Adds an “All” selection option |

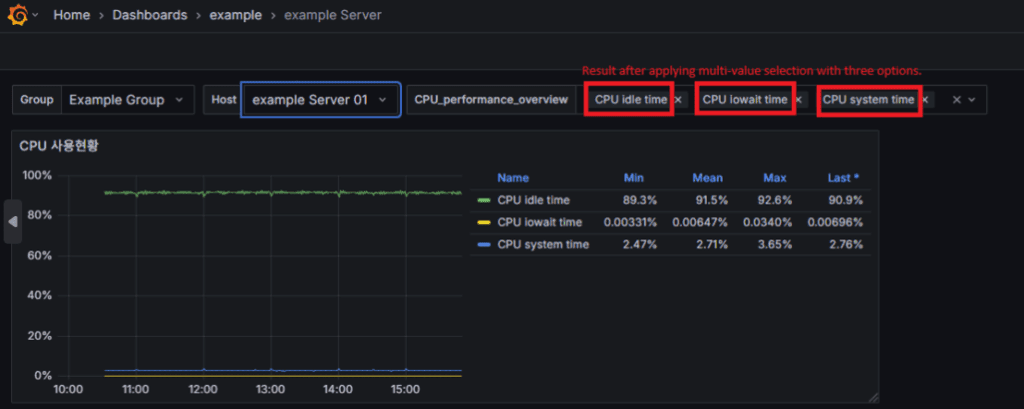
5. Applying Variables to Panels
Now, link the variables to your existing CPU panel.
- Select the CPU panel → Edit
- Query Type: Metrics
- Group:
$Group - Host:
$Host - Item:
$CPU_performance_overview - Delete the previous static query and Save dashboard


💡 With this setup, a single panel can now switch between groups, servers, and metrics instantly.
6. Advantages of a Dynamic Dashboard
| Category | Static Dashboard | Dynamic Dashboard (with Variables) |
|---|---|---|
| Scope | Specific to one server | Shared across multiple servers/groups |
| Scalability | Requires panel duplication | Easily reusable by adding variables |
| Operational Efficiency | Manual edits when adding servers | Instantly reflects changes |
| Readability | Limited | Easy exploration via selection filters |
Ultimately, a variable-based dashboard reduces panel count, simplifies maintenance,
and maximizes operational efficiency.
7. Saving and Validation
Click Save dashboard
→ Use the dropdown menus at the top to switch between Group / Host / Item
→ If graphs respond immediately to changes, the configuration is correct.


8. Practical Tips
- Use English names for variable identifiers and Korean or readable labels for display.
- Always maintain a hierarchical structure: Group → Host → Item.
- Enable Multi-value to build comparison dashboards for multiple servers.
🛠 마지막 수정일: 2025.11.10
ⓒ 2025 엉뚱한 녀석의 블로그 [quirky guy's Blog]. All rights reserved. Unauthorized copying or redistribution of the text and images is prohibited. When sharing, please include the original source link.
💡 도움이 필요하신가요?
Zabbix, Kubernetes, 그리고 다양한 오픈소스 인프라 환경에 대한 구축, 운영, 최적화, 장애 분석이 필요하다면 언제든 편하게 연락 주세요.
📧 Contact: jikimy75@gmail.com
💼 Service: 구축 대행 | 성능 튜닝 | 장애 분석 컨설팅
💡 Need Professional Support?
If you need deployment, optimization, or troubleshooting support for Zabbix, Kubernetes, or any other open-source infrastructure in your production environment, feel free to contact me anytime.
📧 Email: jikimy75@gmail.com
💼 Services: Deployment Support | Performance Tuning | Incident Analysis Consulting
답글 남기기
댓글을 달기 위해서는 로그인해야합니다.