Ready to streamline your complex Zabbix operations?
I’ve distilled the most valuable insights from this blog into one essential guide. Take full control of your environment with the Zabbix 7 Enterprise Optimization Handbook [Mastering Hybrid Infrastructure Monitoring with a Kubernetes First Approach].
👉 Get your PDF copy here: https://jikimy.gumroad.com/l/zabbixmaster
In a Kubernetes environment, monitoring Pod-level network traffic cannot rely on static queries alone. Pods, Hosts, and Groups are constantly changing. This is why leveraging Grafana’s Template Variable feature is essential.
The example below is based on a Pod network monitoring dashboard I built using Zabbix + Grafana.
You can adapt the same approach to fit your own environment and make Grafana more flexible in practice.
1. Dashboard Overview
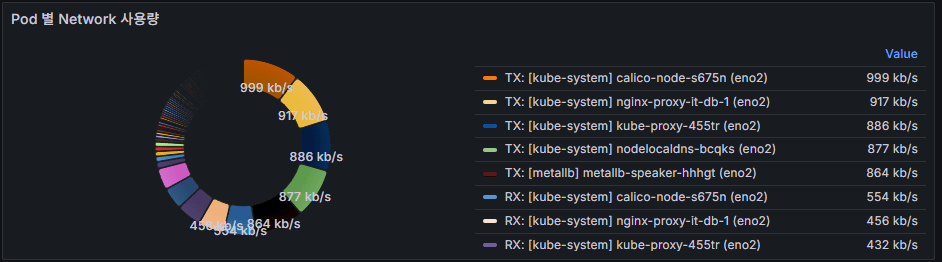
[Figure 1]
[Figure 2]
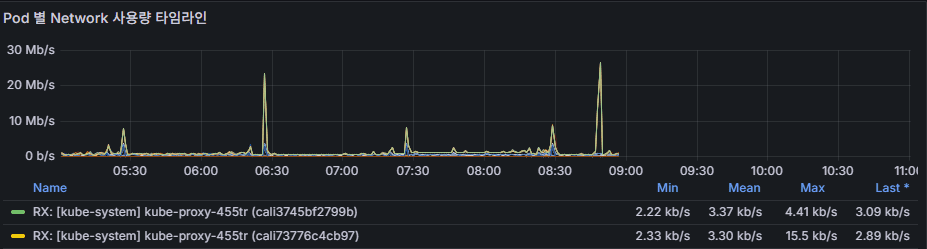
The dashboard above visualizes network usage per Pod.
- [Figure 1]: A status indicator showing current RX/TX traffic usage for each Pod
- [Figure 2]: A time-series chart showing traffic usage trends
This setup does not rely on a single static query. Instead, it is powered by dynamic queries using variables. When you select a specific Group/Host/Item, the data is automatically updated to reflect your choice.
2. Using Group Variables
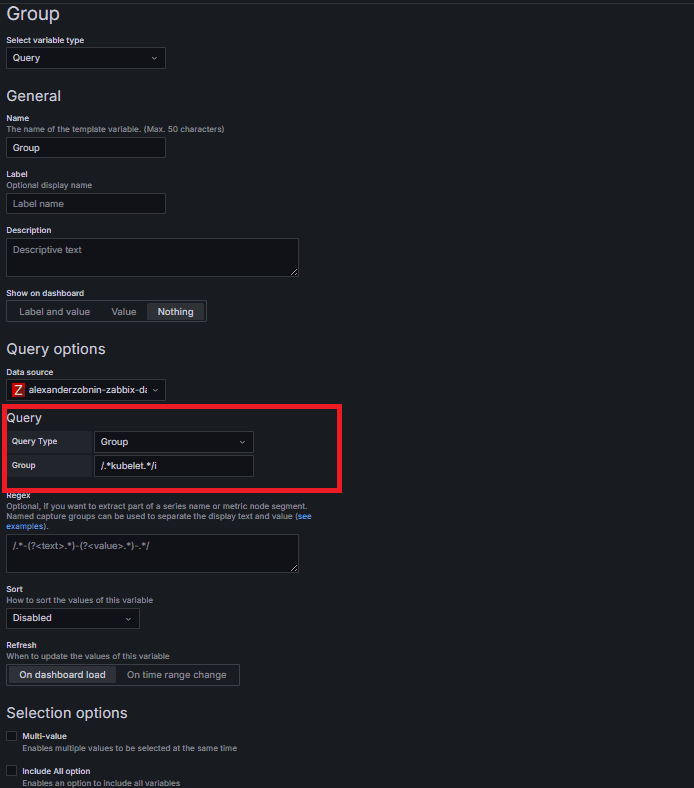
Data Source: Zabbix
Query Type: Group
A Group variable fetches the Host Groups to be monitored. For example, you can filter only those containing kubelet so that only Kubernetes-related nodes are displayed in the dashboard.
👉 Practical Uses
- Filter only specific namespaces or workload groups
- Separate environments (Prod/Dev) for clearer visibility
3. Using Host Variables
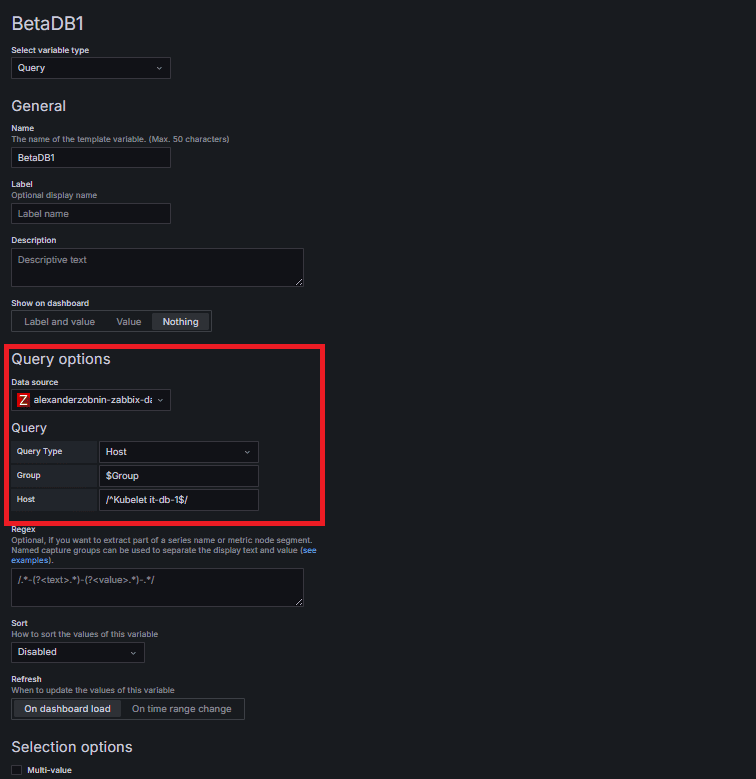
Query Type: Host
Group: $Group
Based on the Group selected above, the corresponding list of Hosts is dynamically loaded. For example, you can select a node like Kubelet app-node-1.
👉 Practical Uses
- Focus monitoring on worker nodes where Pods are running
- Isolate workload-heavy servers such as DB nodes or Proxy servers
4. Using Item Variables – RX / TX
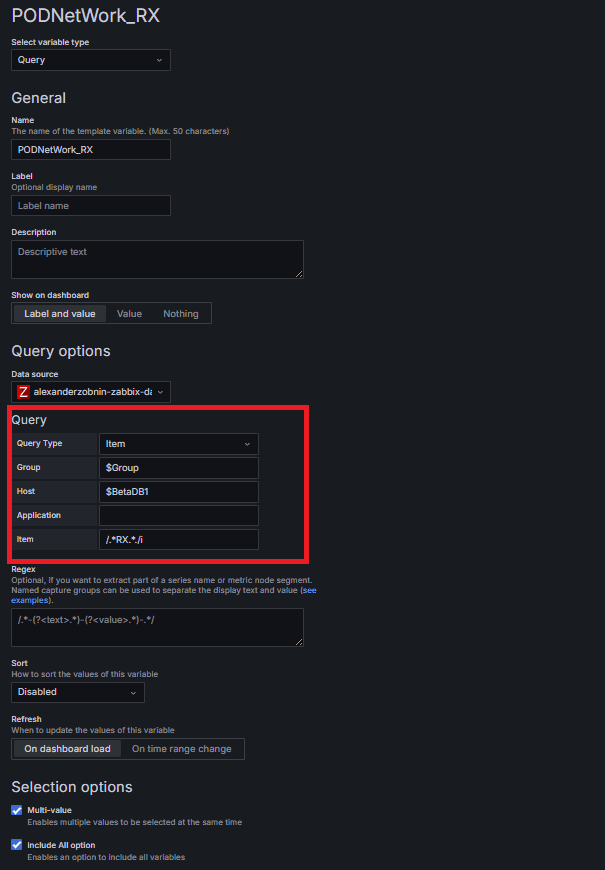
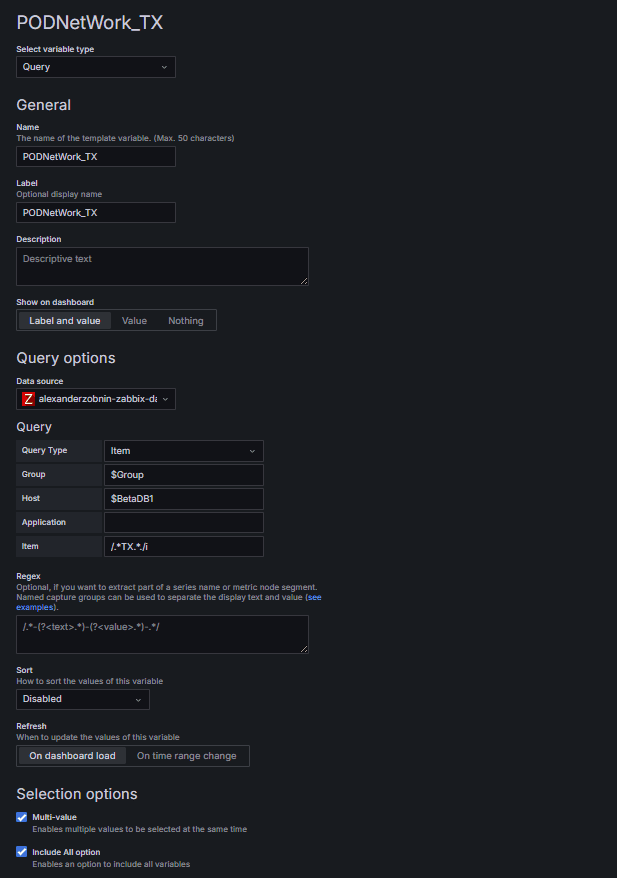
Query Type: Item
Group: $Group
Host: $appDB1
Item: Filter only RX or TX entries
With this setup, only the network-related items from a Host are selected.
This means RX (receive) and TX (transmit) traffic can be monitored separately, or combined for Pod-level visibility.
👉 Practical Uses
- Distinguish Ingress/Egress traffic at the Pod level
- Plot RX and TX on separate charts or aggregate them into a single metric
- Identify bottlenecks in specific Pod network usage
5. Dashboard in Action
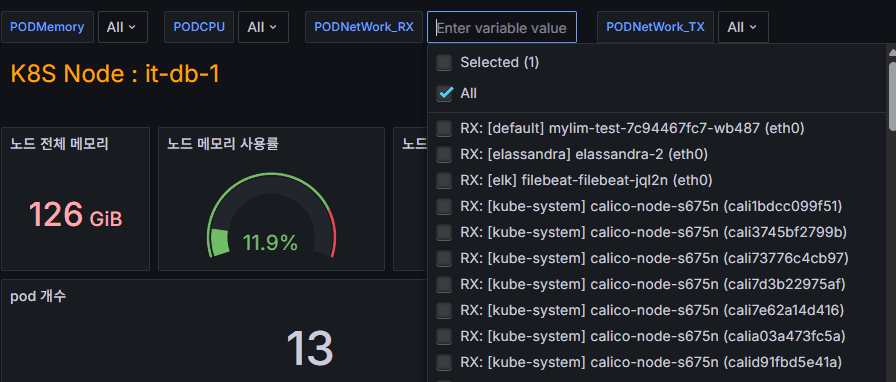
As shown in the figure above, variable drop-down menus appear:
PODNetwork_RXPODNetwork_TX
The operator can select the desired option, and all queries and charts in the dashboard automatically refresh to reflect that choice.
6. Grafana Variable Syntax Overview
Grafana template variables generally fall into three Query Types:
(1) Group
- Retrieves Host Group lists
- Supports filtering (e.g.,
.*kubelet.*)
(2) Host
- Retrieves Hosts from the selected Group
- Can reference upper variables like
$Group - Can match partial names (e.g.,
.*db-1$) - Can also match only a specific Host name (e.g.,
^Kubelet app-node-1$)
(3) Item
- Retrieves metrics (Items) from the selected Host
- Can filter by name patterns (e.g.,
.*TX.*,.*RX.*) - Case-insensitive matching supported (e.g.,
/.*RX.*/i → thei` flag ignores case differences) - Can be restricted by Application if needed
👉 Summary
- The structure follows Group → Host → Item in a dependent chain
- Upper-level variables like
$Groupor$Hostcan be reused in lower queries - In real operations, this design supports Drill-down monitoring from Pod → Node → Network Item
7. Practical Use Cases
- Separate Environments
- Define Group variables for Prod, Dev, and Test so the same dashboard can be reused across environments.
- Network Bottleneck Analysis
- By splitting RX/TX traffic, you can quickly spot if a Pod is sending or receiving excessive traffic.
- Resource Optimization
- Aggregating Pod-level network usage helps identify which nodes are consuming the most bandwidth.
8. Conclusion
Grafana variables (Query) are far more than just filter options. They allow you to:
- Separate environments for reusability
- Drill down into data from high-level to detailed views
- Expose only the most relevant information to the operator
Especially in a Zabbix + Kubernetes integration, designing the Pod → Host → Item structure with variables is the key to making dashboards flexible and powerful.
🛠 마지막 수정일: 2025.12.12
ⓒ 2025 엉뚱한 녀석의 블로그 [quirky guy's Blog]. All rights reserved. Unauthorized copying or redistribution of the text and images is prohibited. When sharing, please include the original source link.
💡 도움이 필요하신가요?
Zabbix, Kubernetes, 그리고 다양한 오픈소스 인프라 환경에 대한 구축, 운영, 최적화, 장애 분석,
광고 및 협업 제안이 필요하다면 언제든 편하게 연락 주세요.
📧 Contact: jikimy75@gmail.com
💼 Service: 구축 대행 | 성능 튜닝 | 장애 분석 컨설팅
📖 E-BooK [PDF] 전자책 (Gumroad):
Zabbix 엔터프라이즈 최적화 핸드북
블로그에서 다룬 Zabbix 관련 글들을 기반으로 실무 중심의 지침서로 재구성했습니다.
운영 환경에서 바로 적용할 수 있는 최적화·트러블슈팅 노하우까지 모두 포함되어 있습니다.
💡 Need Professional Support?
If you need deployment, optimization, or troubleshooting support for Zabbix, Kubernetes,
or any other open-source infrastructure in your production environment, or if you are interested in
sponsorships, ads, or technical collaboration, feel free to contact me anytime.
📧 Email: jikimy75@gmail.com
💼 Services: Deployment Support | Performance Tuning | Incident Analysis Consulting
📖 PDF eBook (Gumroad):
Zabbix Enterprise Optimization Handbook
A single, production-ready PDF that compiles my in-depth Zabbix and Kubernetes monitoring guides.
답글 남기기
댓글을 달기 위해서는 로그인해야합니다.