When a Java-based service becomes slow, the first area you should suspect is GC.
This is especially true for legacy systems running Java 7 or early Java 8 with CMS (Concurrent Mark Sweep), where controlling the Young/Old ratio and Promotion volume is the key to performance.
This guide is written specifically for such environments.
(For modern JVMs like Java 11/17, the GC architecture is entirely different, so these options must not be applied directly.)
1. Key Prerequisites by JVM Version
✔ PermGen exists only up to Java 7 (the most important technical point)
In Java 7 and below, class metadata is stored in the PermGen area.
Starting with Java 8, PermGen was removed and replaced by Metaspace.
Therefore, the following options are valid only for Java 7 or older:
-XX:PermSize
-XX:MaxPermSize
If these options are used in Java 8, the JVM will not fail, but it prints a message and completely ignores them:
warning: ignoring option PermSize=256m; support was removed in 8.0
➡ For Java 8 and above, the correct option is:
-XX:MaxMetaspaceSize=...
Thus, PermGen settings are meaningful only in Java 7 or in early transition phases where Java 8 was configured similarly to Java 7.
✔ CMS GC is fully removed starting from Java 14
The following option worked normally until Java 8, became deprecated in Java 9, and was removed in Java 14:
-XX:+UseConcMarkSweepGC
Modern Java versions (11/17/21) use G1GC by default, with optional ZGC or Shenandoah.
If you specify CMS options, the JVM will not start.
This is why the guide explicitly clarifies that it targets Java 7/8 CMS environments.
2. Young Generation Structure and GC Flow
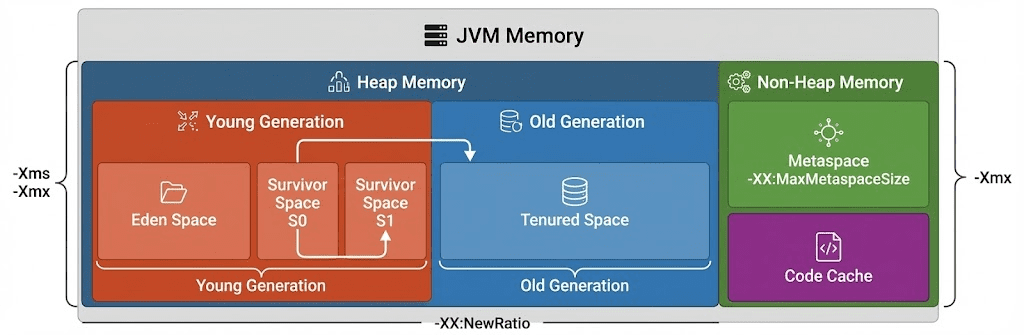
In a CMS environment, the Young generation has the following structure:
Eden → Survivor 1 → Survivor 2
- New objects are created in Eden
- During Minor GC, surviving objects move to S1/S2
- Only objects that survive multiple cycles are promoted to Old
✔ Real effects of enlarging the Young generation
- Promotion decreases → reduced pressure on Old
- Full GC frequency drops significantly
- Most short-lived objects disappear in Young → more stable GC flow
Thus, expanding Young is the most direct way to reduce Full GC in CMS.
3. Why the Default Young/Old Ratio Is 1:2
Most documentation recommends Young : Old = 1 : 2.
Reason:
- Young too small → Promotion spikes → Old fills quickly → Full GC increases
- Old too small → again more Full GC
- 1:2 produces the most stable and predictable pattern
📌 In a healthy JVM, Minor GC should dominate overwhelmingly.
Minor GC: thousands to tens of thousands
Full GC: 1–5 per day → normal pattern
4. Memory Layout with SurvivorRatio = 8
When SurvivorRatio=8, the Young generation is divided into ten logical units:
| Region | Ratio | Formula |
|---|---|---|
| Eden | 8/10 | NewSize × 0.8 |
| Survivor 1 | 1/10 | NewSize × 0.1 |
| Survivor 2 | 1/10 | NewSize × 0.1 |
So the statement Eden ≈ 80%, Survivor ≈ 10% is accurate.
5. Tuning Case Where the Default Ratio Is Overridden
Section 2 described the default Young : Old = 1 : 2 rule.
However, in the real-world example, Young is larger than Old:
Heap = 1408MB
NewSize = 796MB (Young)
Old     = 612MB
Young > Old (about 1.3 : 1)
This is not an incorrect configuration—it is an intentional tuning strategy for a specific workload.
✔ Why was Young made larger than Old?
The target service had these characteristics:
- Massive short-lived object allocation per request
- Most objects disappeared within milliseconds to seconds
- If Promotion occurred frequently, Old would fill rapidly → repeated Full GC
Thus, the tuning goals were:
👉 Make Promotion almost zero
👉 Let most objects die in Eden/Young during Minor GC
👉 Keep Old as a minimal “buffer zone” only
→ For workloads with high short-lived allocation, a larger Young than Old is the correct configuration.
6. Actual JVM Memory Configuration Used in Production
These values were derived based on the actual traffic pattern:
✔ Total Heap: 1408MB
NewSize = 796MB
- Eden ≈ 636MB
- Survivor each ≈ 80MB
Old = 612MB
PermGen = 256MB (Java 7)
This is a very reasonable composition for CMS-based systems with heavy short-lived allocation.
7. JVM Options — Before / After
✔ Before
-Xms1024m -Xmx1024m
-XX:NewSize=512m -XX:MaxNewSize=512m
-XX:PermSize=512m -XX:MaxPermSize=512m
-XX:+DisableExplicitGC

-XX:-PrintGC -XX:-PrintGCDetails -XX:-PrintGCTimeStamps
-XX:+UseConcMarkSweepGC -XX:+CMSParallelRemarkEnabled -XX:+UseParNewGC
✔ After (Java 7)
-Xms1408m -Xmx1408m
-XX:NewSize=796m -XX:MaxNewSize=796m
-XX:PermSize=256m -XX:MaxPermSize=256m
-XX:+DisableExplicitGC

-XX:-PrintGC -XX:-PrintGCDetails -XX:-PrintGCTimeStamps
-XX:+UseConcMarkSweepGC -XX:+CMSParallelRemarkEnabled -XX:+UseParNewGC
Key changes:
- Young expanded → Promotion suppressed
- Old reduced to only what is necessary
- PermGen reduced to appropriate Java 7 levels
8. How to Interpret Full GC
Legacy monolithic or batch-heavy systems → Full GC 3–5 seconds is acceptable
Modern API/MSA architectures → often aim for <1 second
More important than duration:
👉 How frequently Full GC occurs
(Minor thousands / Full single digits → healthy)
9. GC May Look Like the Problem — but the Root Cause Often Lies in the Application
80% of Full GC escalation comes not from tuning, but from code.
Typical causes:
- Storing excessive objects in session
- Keeping large query results entirely in memory
- JDBC Connection leaks
- Inefficient caching
- Object/session reuse not possible
Without fixing these issues, GC tuning alone cannot stabilize the system.
10. Conclusion — The Core Message of This Guide
- This guide targets Java 7/8 CMS environments
- PermGen settings are valid only up to Java 7; Java 8 ignores them
→ Java 8+ must use Metaspace options - Young : Old = 1 : 2 is a default rule, but not universal
→ In many workloads, a larger Young than Old is actually correct - Young enlargement directly reduces Promotion → lowers Full GC
- Many GC issues originate in the application layer, not the JVM
🛠 마지막 수정일: 2025.12.12
ⓒ 2025 엉뚱한 녀석의 블로그 [quirky guy's Blog]. All rights reserved. Unauthorized copying or redistribution of the text and images is prohibited. When sharing, please include the original source link.
💡 도움이 필요하신가요?
Zabbix, Kubernetes, 그리고 다양한 오픈소스 인프라 환경에 대한 구축, 운영, 최적화, 장애 분석,
광고 및 협업 제안이 필요하다면 언제든 편하게 연락 주세요.
📧 Contact: jikimy75@gmail.com
💼 Service: 구축 대행 | 성능 튜닝 | 장애 분석 컨설팅
📖 E-BooK [PDF] 전자책 (Gumroad):
Zabbix 엔터프라이즈 최적화 핸드북
블로그에서 다룬 Zabbix 관련 글들을 기반으로 실무 중심의 지침서로 재구성했습니다.
운영 환경에서 바로 적용할 수 있는 최적화·트러블슈팅 노하우까지 모두 포함되어 있습니다.
💡 Need Professional Support?
If you need deployment, optimization, or troubleshooting support for Zabbix, Kubernetes,
or any other open-source infrastructure in your production environment, or if you are interested in
sponsorships, ads, or technical collaboration, feel free to contact me anytime.
📧 Email: jikimy75@gmail.com
💼 Services: Deployment Support | Performance Tuning | Incident Analysis Consulting
📖 PDF eBook (Gumroad):
Zabbix Enterprise Optimization Handbook
A single, production-ready PDF that compiles my in-depth Zabbix and Kubernetes monitoring guides.
답글 남기기
댓글을 달기 위해서는 로그인해야합니다.