Ready to streamline your complex Zabbix operations?
I’ve distilled the most valuable insights from this blog into one essential guide. Take full control of your environment with the Zabbix 7 Enterprise Optimization Handbook [Mastering Hybrid Infrastructure Monitoring with a Kubernetes First Approach].
👉 Get your PDF copy here: https://jikimy.gumroad.com/l/zabbixmaster
🧭 Looking for related posts? Search for “An Examination of Monitoring Metrics” in the search bar.
In the previous article, we looked at MySQL metrics. This time, we turn to Kafka.
In production environments, Kafka has grown beyond being just a simple message queue to become a critical data streaming platform.
Therefore, closely monitoring the state of Kafka brokers and clusters is essential for preventing incidents and ensuring stable performance.
In this article, we will focus on interpreting and understanding the key Kafka metrics available in the Grafana dashboard (based on Zabbix data).
1. Offline Partitions Count
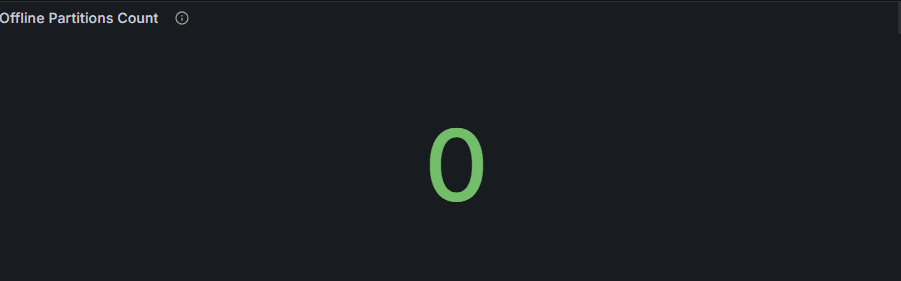
- Meaning: The number of partitions in the cluster that have lost their leader and are therefore inaccessible.
- Normal: 0.
- Abnormal: Occurs during broker failure, network isolation, or disk I/O errors.
👉 Operational Point: Even a single offline partition can imply potential data loss. Investigate immediately.
2. Under Replicated Partitions (URP)
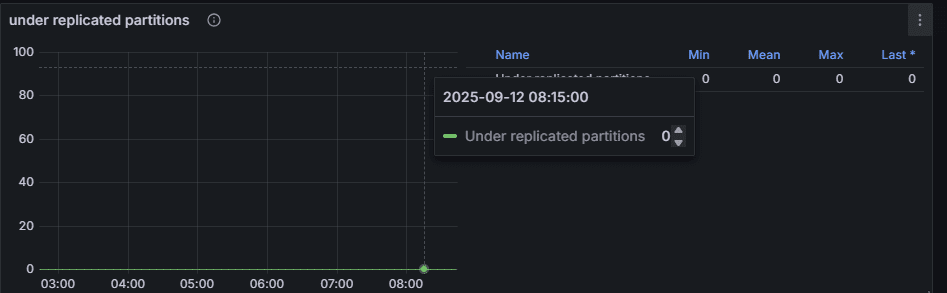
- Meaning: Partitions where follower replicas are not synchronized with the leader.
- Normal: 0.
- Abnormal: Appears under broker overload, network delay, or ISR shrink.
👉 Operational Point: URP is one of the most critical alert indicators in Kafka operations. Even short spikes are a warning sign. If sustained, cluster scaling or incident handling is required.
3. GC Pause
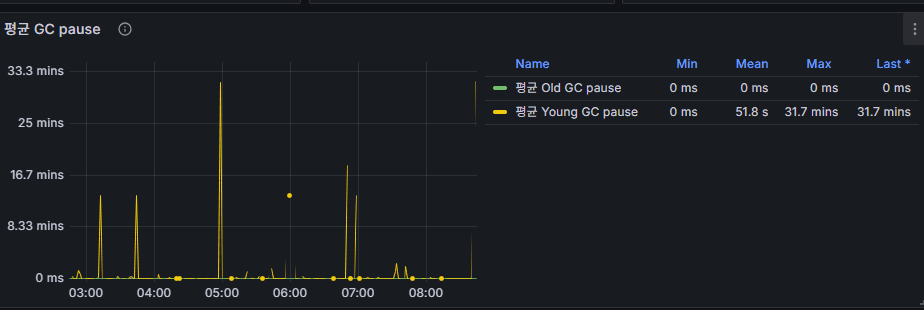
- Meaning: The time the broker JVM application is stopped while Garbage Collection (GC) is executed.
- Young GC (Minor GC): Short and frequent, usually harmless.
- Old GC (Full GC): Rare, but if it lasts hundreds of milliseconds to seconds, the broker essentially stops.
👉 Operational Point: High average pause time leads to message processing delays. Monitor Heap size and GC tuning together.
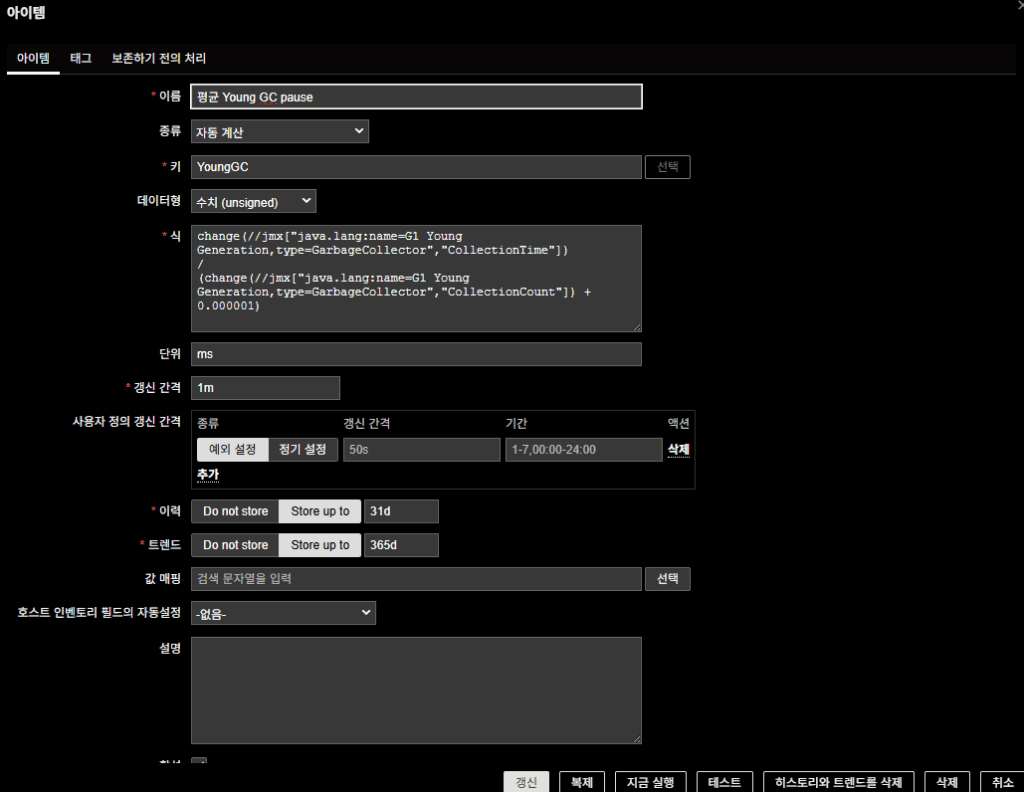
⚠️ Note: The GC Pause metric is not included by default in the Zabbix templates (Apache Kafka by JMX / Generic Java JMX). The following item was created manually using existing JMX items:
change(//jmx["java.lang:name=G1 Young Generation,type=GarbageCollector","CollectionTime"])
/
(change(//jmx["java.lang:name=G1 Young Generation,type=GarbageCollector","CollectionCount"]) + 0.000001)
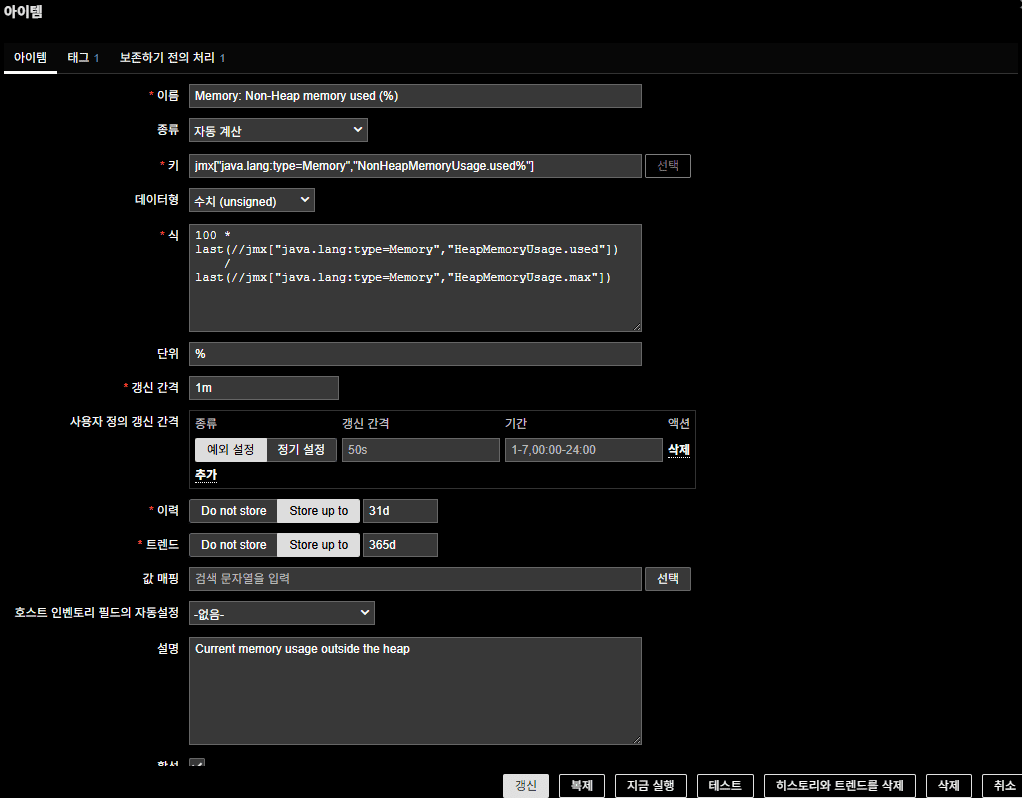
4. Heap Memory Usage
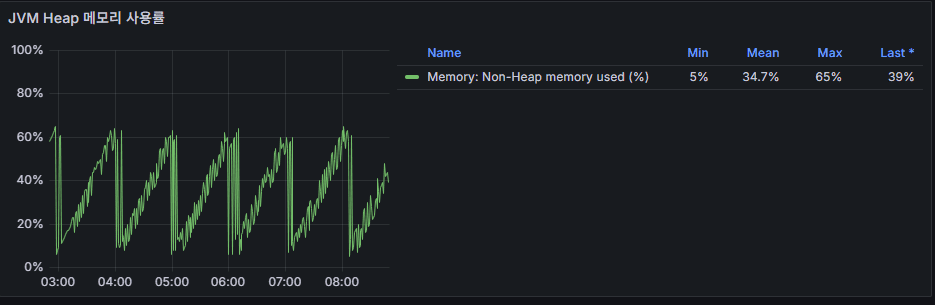
- Meaning: The usage status of the Kafka broker JVM Heap.
- Normal: Stable between 60–80%.
- Abnormal: Spikes above 90% may cause OutOfMemoryError and cascading Full GCs.
👉 Operational Point: Heap usage should always be reviewed alongside GC Pause. High usage + increasing GC Pause means tuning is required.
⚠️ Note: JVM Heap usage is also not part of the default template. A new item was created using existing JMX items with this formula:
100 * last(//jmx["java.lang:type=Memory","HeapMemoryUsage.used"])
/
last(//jmx["java.lang:type=Memory","HeapMemoryUsage.max"])
5. Message Throughput
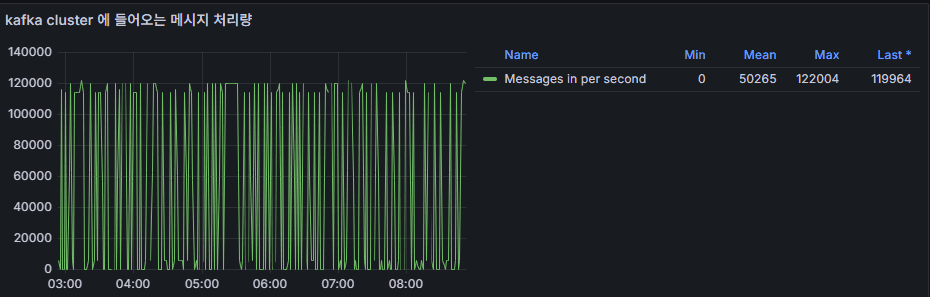
- Meaning: Number of messages processed per second (Messages In / Out per second).
- Usage: Identifying traffic patterns, spotting load peaks, and tracing bottlenecks during incidents.
- Abnormal: Sudden drops in throughput for specific topics may indicate producer or consumer issues.
👉 Operational Point: Throughput should not be interpreted in isolation—always cross-check with Consumer Lag and Broker Latency.
6. Kafka Cluster I/O Traffic
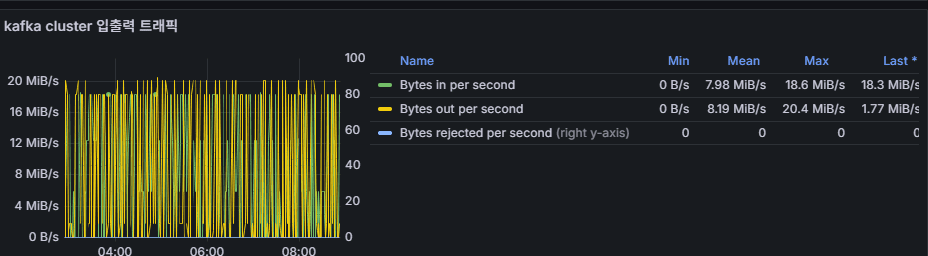
- Meaning: Broker-level network traffic (in MB/s).
- Usage: Assessing topic/partition load balancing.
- Abnormal: If traffic is concentrated on specific brokers, partition leader imbalance is likely.
👉 Operational Point: Larger producer message sizes or batch sizes can also increase network load. Broker balancing should be reviewed.
7. ISR (In-Sync Replicas) Changes
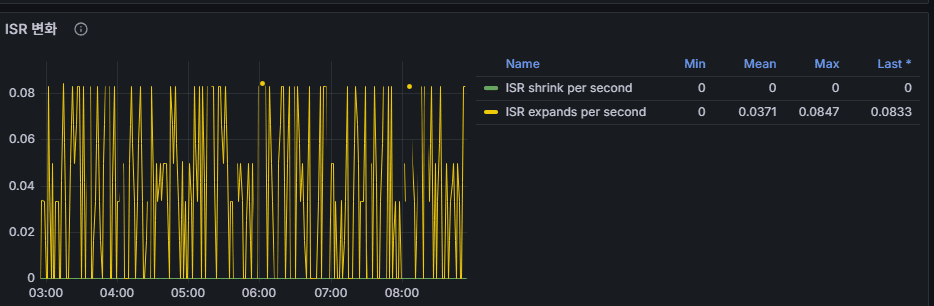
- Definition: The set of follower replicas in each partition that are fully synchronized with the leader.
- A follower is included in the ISR once it has caught up with all messages written to the leader.
- Shrink = ISR count decreases (follower falls behind).
- Expand = ISR count increases (follower catches up and rejoins).
Normal State
- Replica count = ISR count
- All replicas are synchronized with the leader → 100% data durability.
ISR Shrink
- ISR count < Replica count
- Follower failed to keep up (delay, network issues, broker overload, etc.).
- Correlated Metric: URP increases.
ISR Expand
- ISR count grows back toward Replica count
- Followers rejoin after catching up with the leader.
- Indicates recovery.
👉 Operational Point: ISR changes directly impact URP.
- ISR shrink → URP increases → data durability risk.
- Always set alerts on ISR events.
Summary
The key Kafka metrics to monitor in the Grafana dashboard (Zabbix-based) are:
- Offline Partitions Count – Data accessibility
- Under Replicated Partitions (URP) – Data reliability
- GC Pause / Heap Memory Usage – JVM stability
- Message Throughput – Processing performance
- Cluster I/O Traffic – Network bottlenecks
- ISR Changes – Data durability
Kafka monitoring is not about looking at single metrics in isolation. It is about reading correlations:
For example, Heap usage increase → GC Pause increase → Message throughput drop → URP increase.
This sequence reveals risks long before they escalate into incidents.
🛠 마지막 수정일: 2025.12.22
ⓒ 2025 엉뚱한 녀석의 블로그 [quirky guy's Blog]. All rights reserved. Unauthorized copying or redistribution of the text and images is prohibited. When sharing, please include the original source link.
💡 도움이 필요하신가요?
Zabbix, Kubernetes, 그리고 다양한 오픈소스 인프라 환경에 대한 구축, 운영, 최적화, 장애 분석,
광고 및 협업 제안이 필요하다면 언제든 편하게 연락 주세요.
📧 Contact: jikimy75@gmail.com
💼 Service: 구축 대행 | 성능 튜닝 | 장애 분석 컨설팅
📖 E-BooK [PDF] 전자책 (Gumroad):
Zabbix 엔터프라이즈 최적화 핸드북
블로그에서 다룬 Zabbix 관련 글들을 기반으로 실무 중심의 지침서로 재구성했습니다.
운영 환경에서 바로 적용할 수 있는 최적화·트러블슈팅 노하우까지 모두 포함되어 있습니다.
💡 Need Professional Support?
If you need deployment, optimization, or troubleshooting support for Zabbix, Kubernetes,
or any other open-source infrastructure in your production environment, or if you are interested in
sponsorships, ads, or technical collaboration, feel free to contact me anytime.
📧 Email: jikimy75@gmail.com
💼 Services: Deployment Support | Performance Tuning | Incident Analysis Consulting
📖 PDF eBook (Gumroad):
Zabbix Enterprise Optimization Handbook
A single, production-ready PDF that compiles my in-depth Zabbix and Kubernetes monitoring guides.
답글 남기기
댓글을 달기 위해서는 로그인해야합니다.