Ready to streamline your complex Zabbix operations?
I’ve distilled the most valuable insights from this blog into one essential guide. Take full control of your environment with the Zabbix 7 Enterprise Optimization Handbook [Mastering Hybrid Infrastructure Monitoring with a Kubernetes First Approach].
👉 Get your PDF copy here: https://jikimy.gumroad.com/l/zabbixmaster
🧭 Looking for related posts? Search for “An Examination of Monitoring Metrics” in the search bar.
1. Memory Metrics
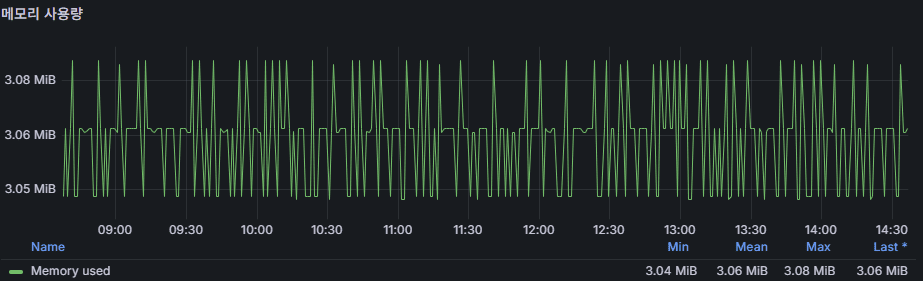
used_memory
- The actual memory consumed by the Redis process.
- A sharp increase in usage compared to physical memory may indicate an OOM (Out Of Memory) risk.
- Always verify
maxmemorysettings and eviction policies.
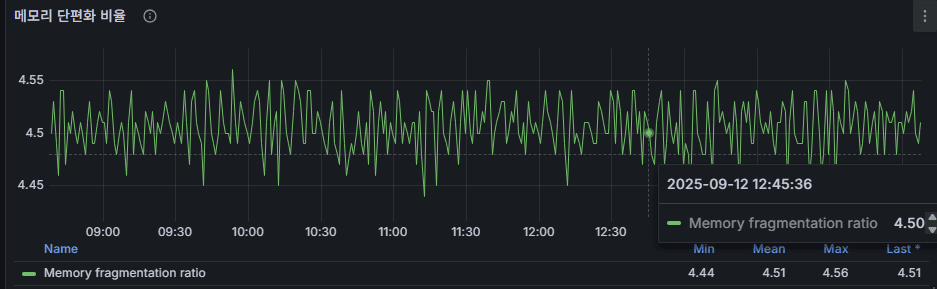
mem_fragmentation_ratio
- Memory fragmentation ratio.
- Close to
1.0is normal. - If ≥ 1.5, fragmentation is severe → consider restart or RDB/AOF rewrite.
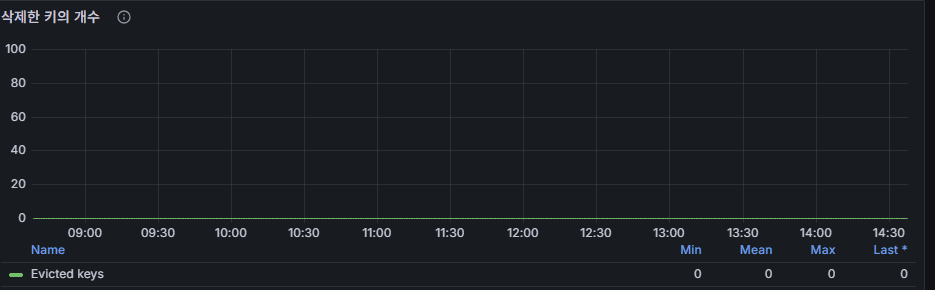
evicted_keys
- Number of keys forcibly removed when
maxmemoryis exceeded. - An increase implies rising cache miss probability.
- Review eviction policies (
noeviction,allkeys-lru, etc.).
2. Performance Metrics
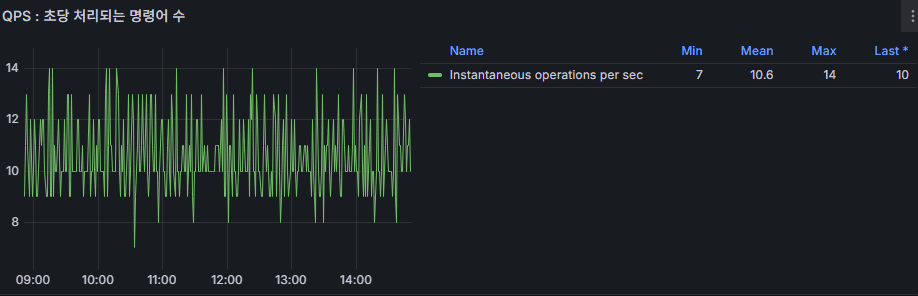
instantaneous_ops_per_sec
- Number of commands processed per second (QPS).
- Useful for identifying traffic spikes.
- Watch for sudden increases or drops against baseline.
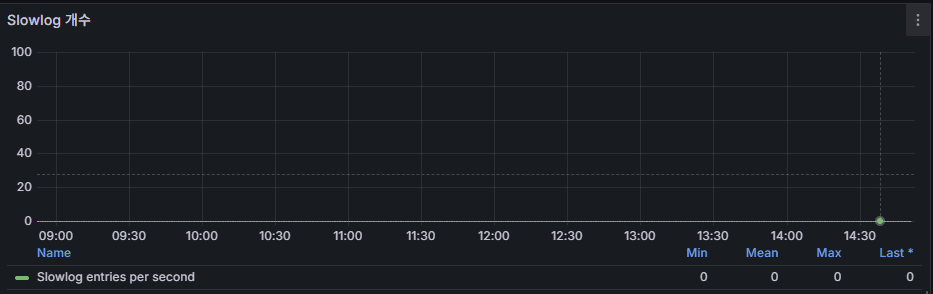
slowlog
- Number of slow query entries recorded in Redis per second.
- A value near
0is normal. - Persistent growth indicates blocking commands or large dataset operations in applications.
3. Connection Metrics
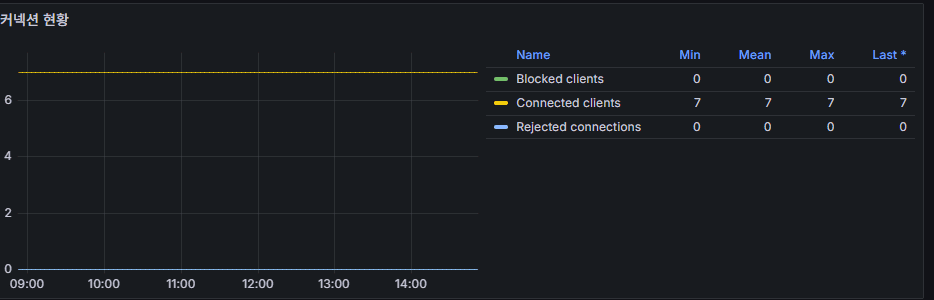
blocked_clients
- Number of clients waiting due to blocking commands (
BRPOP,BLPOP, etc.). - A surge may indicate queue processing bottlenecks.
connected_clients
- Current number of connected clients.
- Compare with application connection pool configuration.
- Approaching
maxclientsrisks new connection failures.
rejected_connections
- Number of connections rejected due to exceeding concurrency limits.
- Frequent increases suggest adjusting client pool settings.
4. Network Metrics
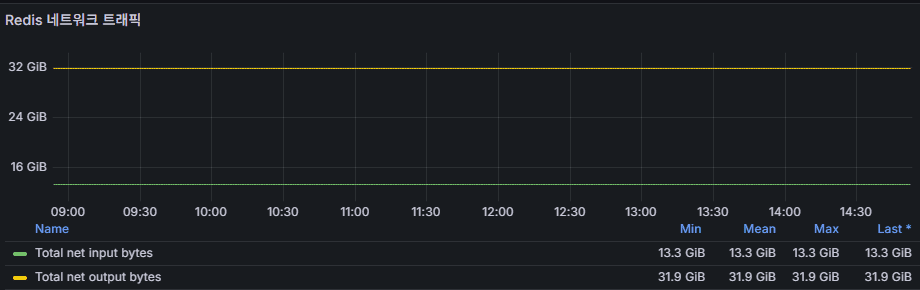
total_net_input_bytes / total_net_output_bytes
- Cumulative inbound/outbound data volume.
- Useful for identifying network bandwidth trends.
- Spikes at specific times may indicate large value
SET/GEToperations.
5. Persistence Metrics
(Persistence: the property of data being safely preserved beyond memory to disk)
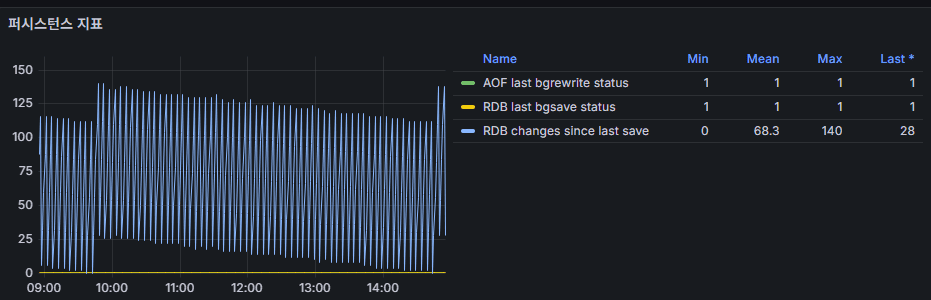
rdb_last_bgsave_status
- Status of the last RDB snapshot (success/failure).
- Failures may be due to insufficient disk space or permission errors.
aof_last_bgrewrite_status
- Status of the last AOF rewrite (success/failure).
- Monitor disk usage when AOF file size grows rapidly.
rdb_changes_since_last_save
- Number of key changes since the last save.
- If it grows excessively beyond the save interval, data loss risk increases in case of failure.
6. Cache Efficiency Metrics
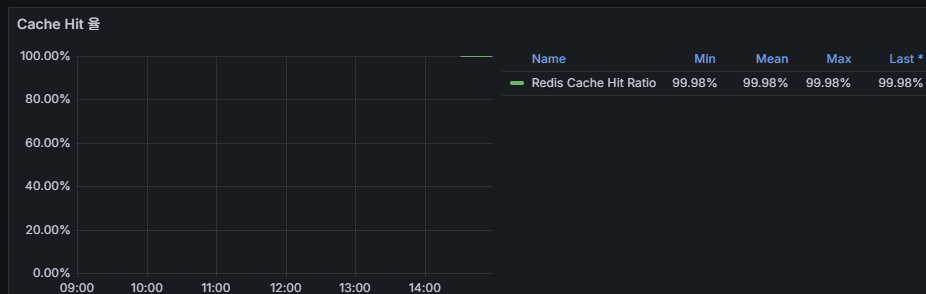
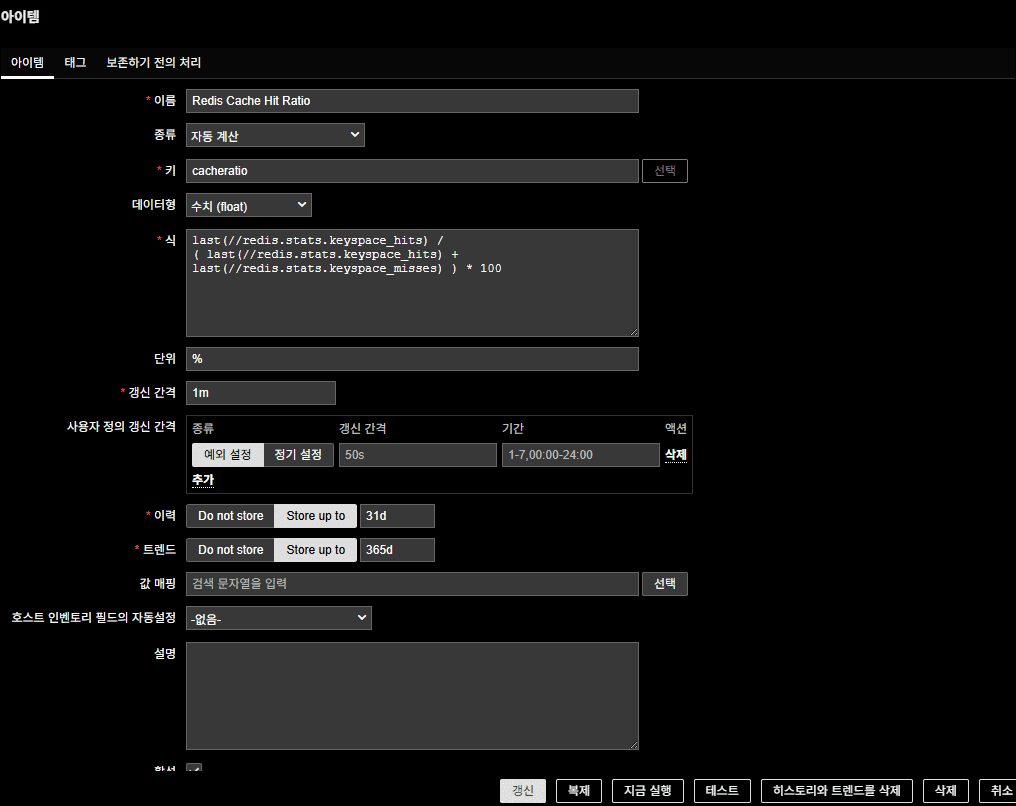
keyspace_hits / keyspace_misses
- Cache Hit Ratio =
hits / (hits + misses)* 100 - Should ideally remain ≥ 90.
- A lower ratio suggests a need to review cache policies or data structures.
⚠ Note: The default Redis template for Zabbix agent2 does not include a Cache Hit Ratio item.
You must create a calculated item based on existing values:
last(//redis.stats.keyspace_hits) /
( last(//redis.stats.keyspace_hits) + last(//redis.stats.keyspace_misses) ) * 100
✅ Operational Guidelines
- Prioritize checking memory usage and fragmentation ratio.
- Monitor connection counts and rejections to identify client connection issues.
- Use ops/sec and slowlog together to detect performance degradation.
- Watch cache hit ratio and evicted_keys growth as signals for reviewing cache policies.
🛠 마지막 수정일: 2025.12.22
ⓒ 2025 엉뚱한 녀석의 블로그 [quirky guy's Blog]. All rights reserved. Unauthorized copying or redistribution of the text and images is prohibited. When sharing, please include the original source link.
💡 도움이 필요하신가요?
Zabbix, Kubernetes, 그리고 다양한 오픈소스 인프라 환경에 대한 구축, 운영, 최적화, 장애 분석,
광고 및 협업 제안이 필요하다면 언제든 편하게 연락 주세요.
📧 Contact: jikimy75@gmail.com
💼 Service: 구축 대행 | 성능 튜닝 | 장애 분석 컨설팅
📖 E-BooK [PDF] 전자책 (Gumroad):
Zabbix 엔터프라이즈 최적화 핸드북
블로그에서 다룬 Zabbix 관련 글들을 기반으로 실무 중심의 지침서로 재구성했습니다.
운영 환경에서 바로 적용할 수 있는 최적화·트러블슈팅 노하우까지 모두 포함되어 있습니다.
💡 Need Professional Support?
If you need deployment, optimization, or troubleshooting support for Zabbix, Kubernetes,
or any other open-source infrastructure in your production environment, or if you are interested in
sponsorships, ads, or technical collaboration, feel free to contact me anytime.
📧 Email: jikimy75@gmail.com
💼 Services: Deployment Support | Performance Tuning | Incident Analysis Consulting
📖 PDF eBook (Gumroad):
Zabbix Enterprise Optimization Handbook
A single, production-ready PDF that compiles my in-depth Zabbix and Kubernetes monitoring guides.
답글 남기기
댓글을 달기 위해서는 로그인해야합니다.