Simulated Attack Testing and Alert → Drop Transition
In this final part, we write custom Suricata rules directly, reproduce simulated attack traffic in a browser environment, and walk through the complete flow from alert detection to drop enforcement and ELK verification.
Two attack scenarios are covered:
- Type 1: Web attacks abusing input parameters on the
/searchpath - Type 2: UNION-based SQL injection attacks embedded in a GET request URI
1. Custom Rule Management Structure
1.1 Rule File Location
In a standard Suricata package installation environment (Ubuntu-based), custom rules are managed in the following file:
/var/lib/suricata/rules/local.rulesAutomatically updated rule files (suricata.rules, emerging.rules, etc.) must never be edited directly.
Custom rules must always be separated into their own file.
1.2 Rule Loading Verification in suricata.yaml
/etc/suricata/suricata.yaml
default-rule-path: /var/lib/suricata/rules
rule-files:
  - suricata.rules
  - local.rules
2. Suricata Rule Syntax: Structure and Concepts
A Suricata rule consists of two main parts:
- Rule Header: Defines which traffic the rule applies to (protocol, source, destination, ports, direction)
- Rule Options: Defines what to look for within that traffic (HTTP fields, strings, regex, thresholds, etc.)
2.1 Rule Header Syntax
Format
ACTION PROTO SRC_IP SRC_PORT -> DST_IP DST_PORTExample
alert http $EXTERNAL_NET any -> $HOME_NET anyComponent Breakdown
ACTION
alert: Detect only. Traffic is allowed.drop: Block packets in an inline IPS environment.
For drop to have effect, Suricata must be running in inline mode (NFQUEUE, AF_PACKET IPS, etc.).
PROTO
- Can specify L4 protocols such as
tcp,udp,icmp - Or application-layer protocols such as
http
In practice, web attack detection often uses http, combined with options like http.uri, http.method, etc.
SRC_IP / DST_IP
$EXTERNAL_NETand$HOME_NETare variables defined insuricata.yaml$EXTERNAL_NET any -> $HOME_NET anyfocuses on inbound traffic from external sources
SRC_PORT / DST_PORT
anycan be used to cover all ports- Specific ports (80/443) can be used, but be cautious—HTTP does not always run only on standard ports
Overly strict port filtering may cause missed detections.
Direction
->means traffic flowing from source to destination- For web requests, this usually represents client → server
2.2 Rule Options Syntax
Options are listed inside parentheses as key:value; pairs.
(msg:"..."; flow:...; http.uri; content:"..."; sid:...; rev:...;)The execution order of options matters to some extent.
Scoping keywords such as http.uri change the context for subsequent matches.
2.2.1 msg
msg:"LAB7 A1: Suspicious input pattern in /search";A human-readable description recorded in events.
In operational environments, using consistent prefixes makes rule management easier.
2.2.2 flow:to_server,established
flow:to_server,established;This option helps reduce false positives.
to_server: Inspect only requests directed toward the serverestablished: Inspect only sessions with a completed TCP handshake
This avoids noise from scans or half-open connections.
2.2.3 HTTP Field Scoping (http.uri, http.method, etc.)
Example
http.uri;
content:"/search";
Declaring http.uri scopes subsequent content and pcre matches to the URI field.
http.method; content:"POST";Checks whether the request method is POST.
Field-level scoping greatly improves detection accuracy compared to scanning the entire packet.
2.2.4 content
content:"/login"; nocase;Basic string matching.
nocaseignores case sensitivity- Often used as a preliminary filter to narrow the match scope
Example: limit to /login first, then apply thresholds.
2.2.5 pcre (Regular Expressions)
pcre:"/union\s+select/Ui";Used for complex pattern detection.
\s+: one or more whitespace charactersU: ungreedy matchingi: case-insensitive
Regex is powerful but more expensive, so it is typically preceded by content filters.
2.2.6 threshold (Repetition / Abuse Patterns)
threshold:type both, track by_src, count 10, seconds 60;Suitable for detecting repeated behavior such as login attempts, scanners, or flooding.
Interpretation
track by_src: count per source IPcount 10, seconds 60: trigger if 10 or more events occur within 60 secondstype both: event and rate-limiting behavior (tunable per environment)
2.2.7 classtype, sid, rev
classtype:attempted-admin; sid:1007002; rev:1;rev: rule revision number (increment on changes)classtype: classification, useful for dashboard groupingsid: unique rule ID; custom rules should use a reserved internal range to avoid conflicts
3. Writing Custom Rules for the Lab (Alert Stage)
Add the following rules to:
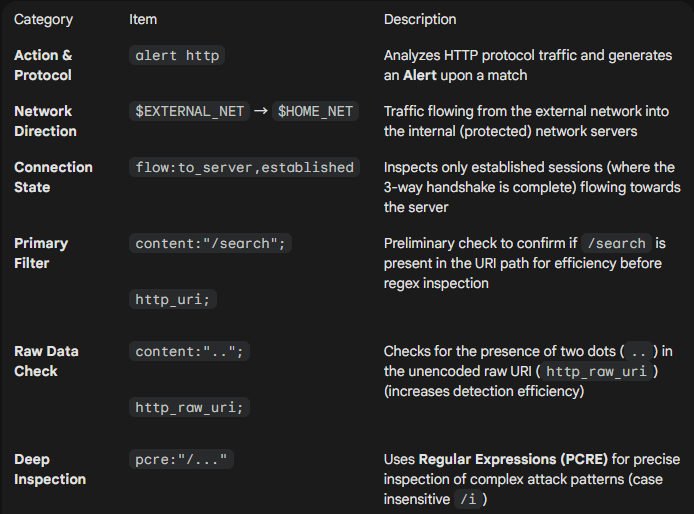
/var/lib/suricata/rules/local.rules3.1 Attack Type 1 (LAB A1) — Parameter Abuse on /search
Target endpoint
/search?q=...alert http $EXTERNAL_NET any -> $HOME_NET any (msg:"LAB A1: Suspicious input pattern in /search"; flow:to_server,established; content:"/search"; http_uri; content:".."; http_raw_uri; pcre:"/(\.\.\/|%2e%2e%2f|union\s+select|%75%6e%69%6f%6e\s+%73%65%6c%65%63%74)/i"; classtype:web-application-attack; sid:1007001; rev:2;)Rule interpretation :
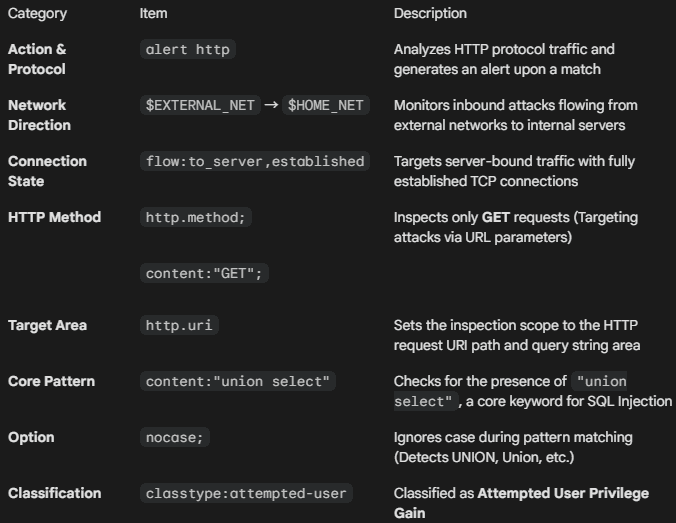
3.2 Attack Type 2 (LAB B1) — UNION-Based SQL Injection in GET URI
alert http $EXTERNAL_NET any -> $HOME_NET any (msg:"LAB B1: SQL Injection Attempt"; flow:to_server,established; http.method; content:"GET"; http.uri; content:"union select"; nocase; classtype:attempted-user; sid:1007002; rev:1;)Rule interpretation :
4. Rule Validation and Application
- Validate rule syntax
# suricata -T -c /etc/suricata/suricata.yaml- Stop the running inline Suricata process
# ps -ef | grep suricata | grep -v grep | awk '{print $2}' | xargs kill -9 2>/dev/null- Remove stale PID file
# rm -f /var/run/suricata.pid- Start Suricata in inline mode (background)
# suricata -c /etc/suricata/suricata.yaml -q 0 -D- Verify execution
# ps -ef | grep suricata5. Attack Traffic Testing
Before triggering attacks in the browser, run the log monitoring commands in the terminal.
5.1 Browser Tests
Enter the following URLs in the address bar:
LAB A1
http://<TARGET_IP>/search?q=../../../../etc/passwdResult: 404
LAB B1
http://<TARGET_IP>/search?q=1%20union%20select%201,2,3Result: 404
5.2 Log Verification
LAB A1
# tail -f /var/log/suricata/eve.json | grep "1007001"LAB B1
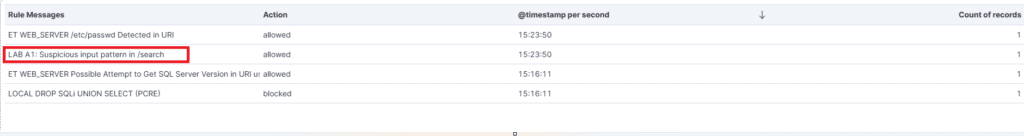
# tail -f /var/log/suricata/eve.json | grep "1007002"5.3 Kibana Dashboard Verification
- LAB A1 detection
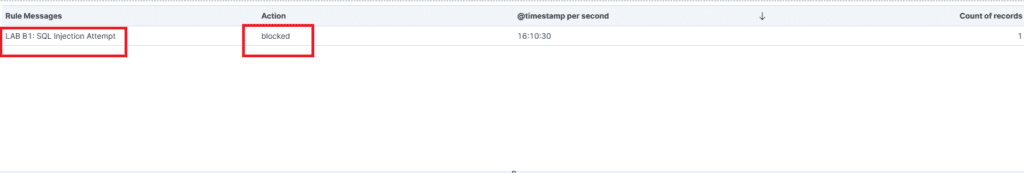
- LAB B1 detection

6. Alert → Drop Transition
For attack type 2 (LAB B1), convert the rule from alert to drop.
drop http $EXTERNAL_NET any -> $HOME_NET any (msg:"LAB B1: SQL Injection Attempt"; flow:to_server,established; http.method; content:"GET"; http.uri; content:"union select"; nocase; classtype:attempted-user; sid:1007002; rev:1;)Apply the change:
# ps -ef | grep suricata | grep -v grep | awk '{print $2}' | xargs kill -9 2>/dev/null
# rm -f /var/run/suricata.pid
# suricata -c /etc/suricata/suricata.yaml -q 0 -D
Open a new browser window, retry the attack, and confirm the drop event or block indicator in the Kibana dashboard.
7. Summary
At this point, the following workflow is complete:
- Simulated attack traffic reproduction
- Alert-based detection verification
- Rule transition to drop
- Confirmation of blocking effectiveness in ELK
This completes the series.
🛠 마지막 수정일: 2025.12.31
ⓒ 2026 엉뚱한 녀석의 블로그 [quirky guy's Blog]. All rights reserved. Unauthorized copying or redistribution of the text and images is prohibited. When sharing, please include the original source link.
💡 도움이 필요하신가요?
Zabbix, Kubernetes, 그리고 다양한 오픈소스 인프라 환경에 대한 구축, 운영, 최적화, 장애 분석,
광고 및 협업 제안이 필요하다면 언제든 편하게 연락 주세요.
📧 Contact: jikimy75@gmail.com
💼 Service: 구축 대행 | 성능 튜닝 | 장애 분석 컨설팅
📖 E-BooK [PDF] 전자책 (Gumroad):
Zabbix 엔터프라이즈 최적화 핸드북
블로그에서 다룬 Zabbix 관련 글들을 기반으로 실무 중심의 지침서로 재구성했습니다.
운영 환경에서 바로 적용할 수 있는 최적화·트러블슈팅 노하우까지 모두 포함되어 있습니다.
💡 Need Professional Support?
If you need deployment, optimization, or troubleshooting support for Zabbix, Kubernetes,
or any other open-source infrastructure in your production environment, or if you are interested in
sponsorships, ads, or technical collaboration, feel free to contact me anytime.
📧 Email: jikimy75@gmail.com
💼 Services: Deployment Support | Performance Tuning | Incident Analysis Consulting
📖 PDF eBook (Gumroad):
Zabbix Enterprise Optimization Handbook
A single, production-ready PDF that compiles my in-depth Zabbix and Kubernetes monitoring guides.
답글 남기기
댓글을 달기 위해서는 로그인해야합니다.