1. Position and Objective of This Part
Position in the Series
- Parts 1–4: Suricata NAT Instance–based IPS configuration / alert and drop verification
- Part 5: Single-node ELK installation on the NAT Instance
- Part 6 (this part):
- Properly send Suricata logs into ELK
- Extract only meaningful fields
- Build dashboards that immediately reflect an attack-oriented view
- Part 7: Writing Suricata rules directly (series conclusion)
What Will Be Completed in This Part
- Suricata
eve.json→ Logstash input - Logstash filtering:
- Alert / drop classification
- Normalization of
rule.sid,msg,src_ip,dest_ip
- Elasticsearch index design
- Kibana dashboards:
- Alert vs Drop
- Top Attacker IP
- Rule Hit Ranking
2. Prerequisites
Assume the following state:
- Suricata is running normally on the NAT Instance
- A web server for attack testing exists
- The ELK stack is installed on the NAT Instance
- Suricata is generating
eve.jsonlogs
Verify Suricata configuration:
# grep -n "eve-log" /etc/suricata/suricata.yamlDefault log location:
/var/log/suricata/eve.json3. Preparing Attack Patterns (To Generate Logs)
This part assumes that the following attacks have already occurred.
Example attack types used:
- SQL Injection
- XSS
- Command Injection
- Malicious User-Agent
For simulated attacks, refer to Part 4 of this series.
What matters here is that Suricata has generated both alert and drop logs.
4. Logstash Input Configuration (Suricata eve.json)
4.1 Create the Logstash Pipeline File
# vi /etc/logstash/conf.d/suricata.conf4.2 Input Configuration
input {
  file {
    path => "/var/log/suricata/eve.json"
    start_position => "beginning"
    sincedb_path => "/var/lib/logstash/sincedb-suricata"
    codec => json
  }
}- Read
eve.jsondirectly using a file input - Use the JSON codec (
eve.jsonis JSON Lines format)
5. Logstash Filter Design (Core)
Add the following configuration to/etc/logstash/conf.d/suricata.conf
filter {
  # 0) Keep only alert / drop events and discard the rest
  #    (dns/http/flow/stats are dropped here if unused)
  if !([event_type] in ["alert","drop"]) {
    drop { }
  }

  # 1) Convert Suricata timestamp to @timestamp (Kibana time field)
  if [timestamp] {
    date {
      match    => ["timestamp", "ISO8601"]
      target   => "@timestamp"
      timezone => "UTC"
    }
  }

  # 2) Normalize action field
  #    alert events usually have [alert][action],
  #    drop events may not, depending on the environment
  if [alert][action] {
    mutate { add_field => { "suricata_action" => "%{[alert][action]}" } }
  } else {
    mutate { add_field => { "suricata_action" => "%{[event_type]}" } }
  }

  # 3) Flatten rule fields (safe rename, fields may not exist)
  mutate {
    rename => {
      "[alert][signature]"    => "rule_msg"
      "[alert][signature_id]" => "rule_sid"
    }
  }

  # 4) Keep event_type for Alert vs Drop distinction
  #    Retain only minimal fields required for dashboards
  prune {
    whitelist_names => [
      "^@timestamp$",
      "^event_type$",
      "^suricata_action$",
      "^rule_sid$",
      "^rule_msg$",
      "^src_ip$",
      "^dest_ip$"
    ]
  }
}
6. Elasticsearch Output and Index Design
6.1 Output Configuration
Add to /etc/logstash/conf.d/suricata.conf
output {
  elasticsearch {
    hosts => ["https://localhost:9200"]
    index => "suricata-%{+YYYY.MM.dd}"
    user => "elastic"
    password => "ELASTIC_PASSWORD"   # apply the actual password
    ssl => true
    ssl_certificate_verification => false
  }
}
6.2 Index Design Rationale
- Daily index:
suricata-YYYY.MM.dd - Default shard/replica settings are sufficient for a lab
- In production, ILM should be used
6.3 Restart Logstash
# systemctl restart logstashVerification:
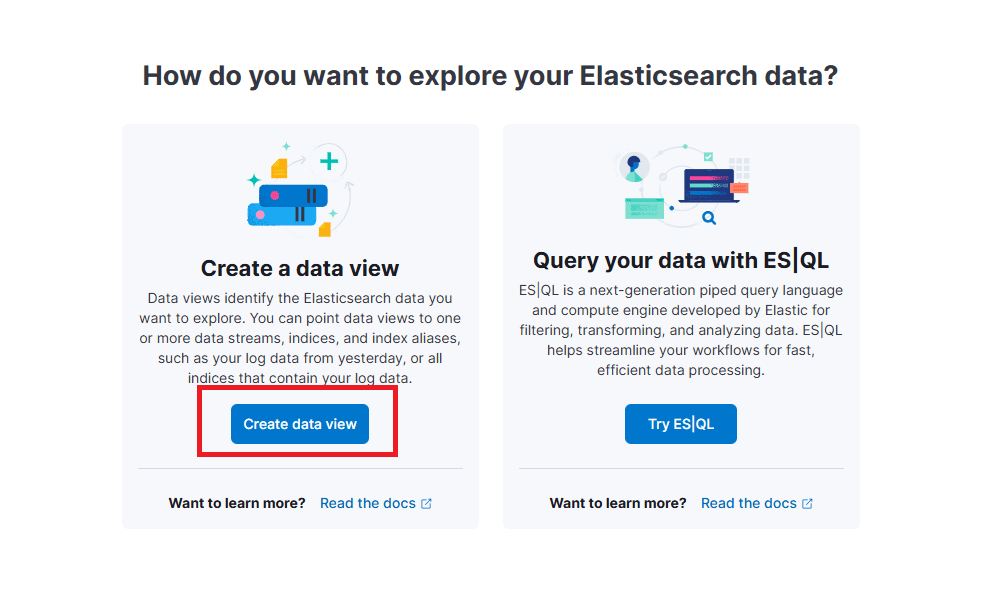
# journalctl -u logstash -f7. Creating a Kibana Data View
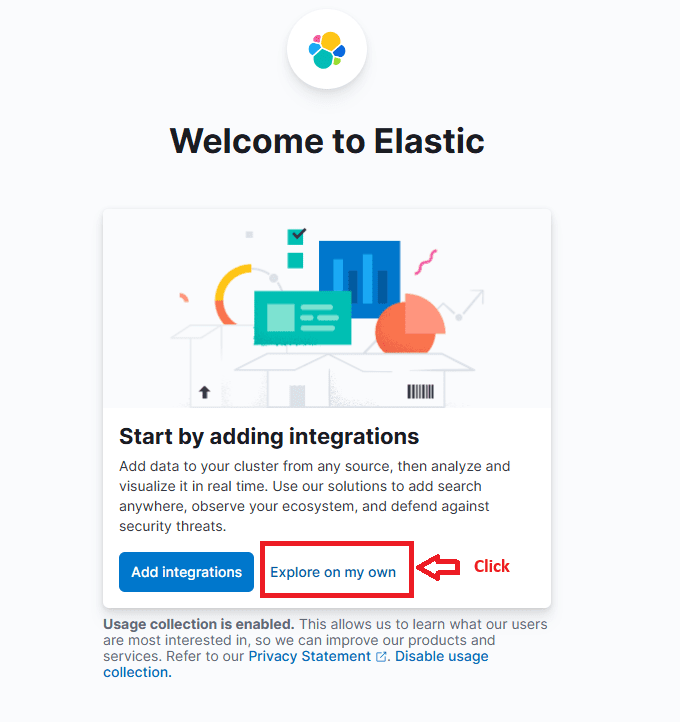
Access Kibana.
Click Explore on my own.
Generate sample logs by triggering a test attack in the browser:
http://<NAT_Public_IP>/cmd.php?cmd=cat%20/etc/passwdNavigate to:
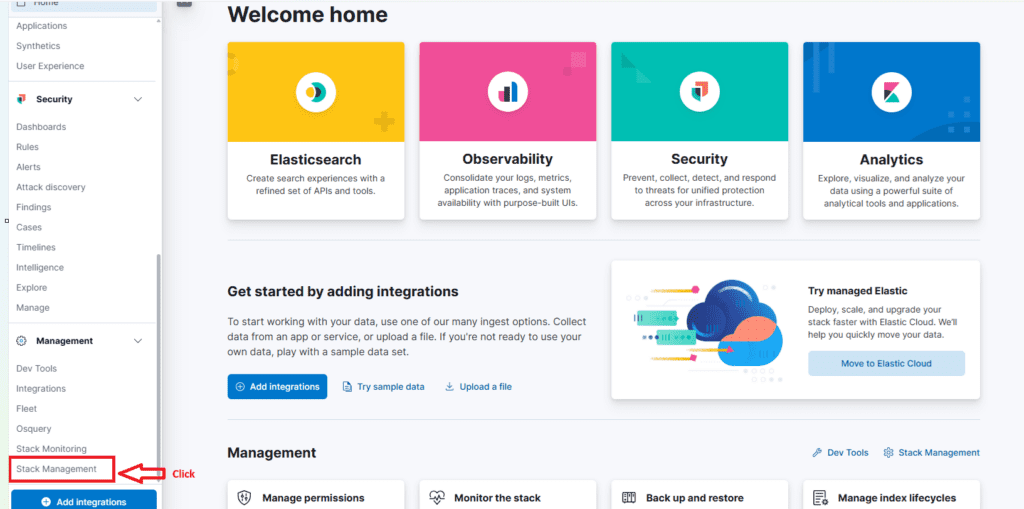
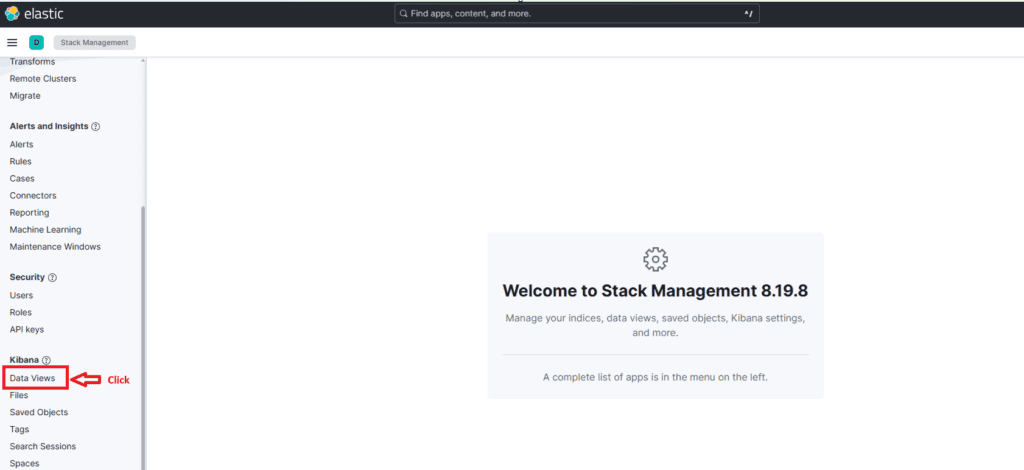
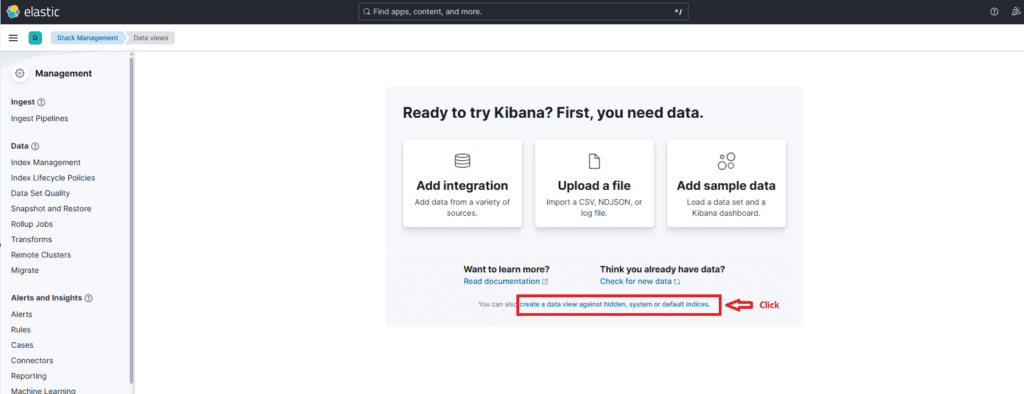
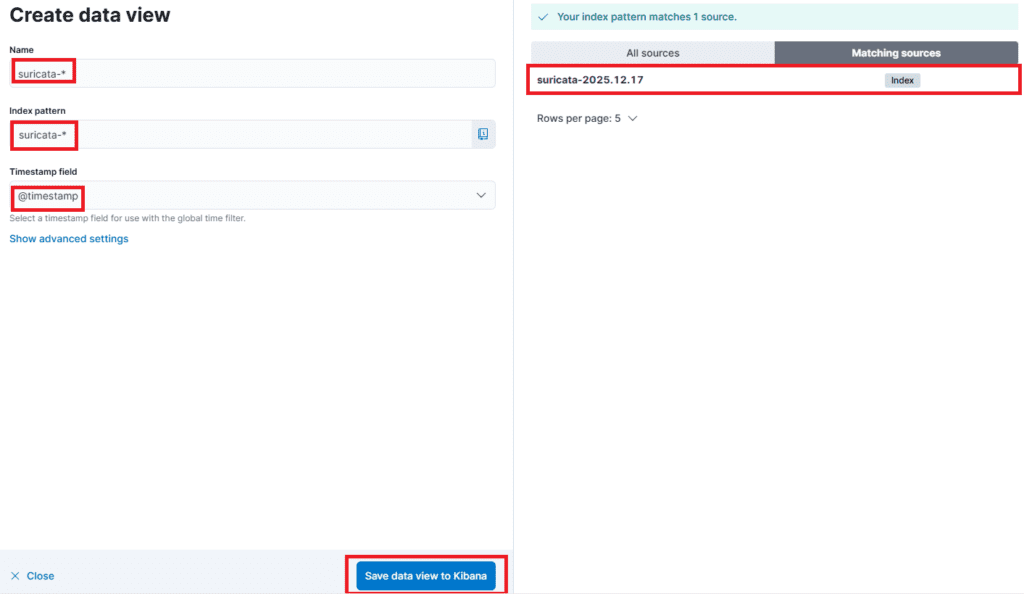
Stack Management → Data Views → Create data view
or
Create a data view against hidden indices
Settings:
- Name:
suricata-* - Index pattern:
suricata-* - Timestamp field:
@timestamp
Save the data view to Kibana.
8. Kibana Dashboard Construction (Core)
Build dashboards that provide immediate security insight.
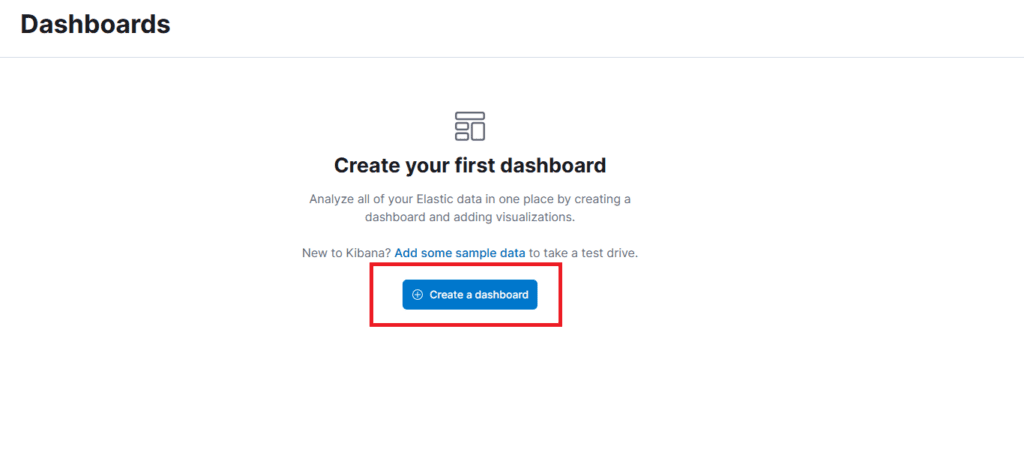
Start creating a dashboard:
- In the left menu, go to Analytics → Dashboard
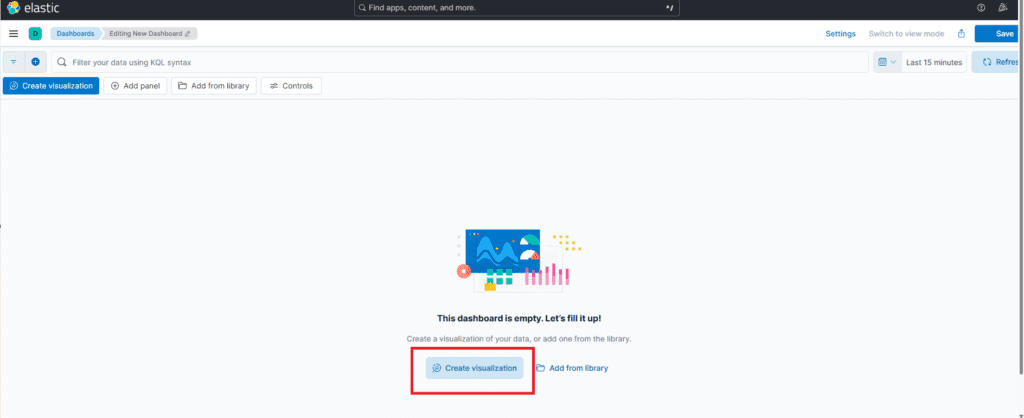
- Click Create dashboard
- Click Create visualization

8.1 Alert vs Drop (Donut Chart)
- Visualization: Pie / Donut
- Aggregation:
- Terms:
suricata_action
- Terms:
Result:
- allowed (alert)
- blocked (drop)
This shows, at a glance, the ratio of traffic actually blocked by the IPS.
Creation steps:
- Select Pie
- Drag
suricata_action.keywordto Slice by - Drag Records to Metric
- Switch to Donut chart and save


8.2 Top Attacker IP
- Visualization: Vertical Bar
- X-axis: Terms →
src_ip - Y-axis: Records
- Size: Top 5
Shows the IPs with the highest number of attack attempts.
Creation steps:
- Click Create visualization again
- Select Bar
- Drag
src_ip.keywordto the Horizontal axis - Drag Records to the Vertical axis
- Save and return
8.3 Rule Hit Ranking
- Visualization: Data Table or Bar
- Terms:
rule_sidor similar - Metric: Records
Shows which attack types occur most frequently.
Creation steps:
- Click Create visualization again
- Select Table
- Drag
rule_msg.keywordto Rows - Drag
suricata_action.keywordto Rows - Drag
@timestampto Rows - Drag Records to Metrics
- Save and return
Important notes:
- In the Rows section, click
@timestampand disable Include empty rows (critical)- If enabled, rows are generated for time buckets with no data, making it appear as if attacks occurred continuously
- Set Minimum interval to seconds
- In Lens tables, increase Number of values (100 or more) for each row field if you want to see individual events
Strategically placing more fields such as source and destination IPs significantly improves detection accuracy and response speed.
Dashboard :

9. Key Points of This Architecture
- Do not analyze raw Suricata logs as-is
- Use Logstash to retain only security-relevant fields
- Kibana is not for “pretty dashboards”
- It is for immediately answering:
- Is traffic being blocked?
- Who is attacking?
- What attack types are most common?
10. Preview of Part 7 (Final)
- Writing Suricata rules directly
- Core rule syntax
- HTTP / URI / Header–based rules
- Alert → Drop transition strategy
- Writing custom rules for lab use
- Verifying rule effectiveness in ELK
→ Completion of the Detect → Block → Visualize → Improve loop
🛠 마지막 수정일: 2025.12.29
ⓒ 2026 엉뚱한 녀석의 블로그 [quirky guy's Blog]. All rights reserved. Unauthorized copying or redistribution of the text and images is prohibited. When sharing, please include the original source link.
💡 도움이 필요하신가요?
Zabbix, Kubernetes, 그리고 다양한 오픈소스 인프라 환경에 대한 구축, 운영, 최적화, 장애 분석,
광고 및 협업 제안이 필요하다면 언제든 편하게 연락 주세요.
📧 Contact: jikimy75@gmail.com
💼 Service: 구축 대행 | 성능 튜닝 | 장애 분석 컨설팅
📖 E-BooK [PDF] 전자책 (Gumroad):
Zabbix 엔터프라이즈 최적화 핸드북
블로그에서 다룬 Zabbix 관련 글들을 기반으로 실무 중심의 지침서로 재구성했습니다.
운영 환경에서 바로 적용할 수 있는 최적화·트러블슈팅 노하우까지 모두 포함되어 있습니다.
💡 Need Professional Support?
If you need deployment, optimization, or troubleshooting support for Zabbix, Kubernetes,
or any other open-source infrastructure in your production environment, or if you are interested in
sponsorships, ads, or technical collaboration, feel free to contact me anytime.
📧 Email: jikimy75@gmail.com
💼 Services: Deployment Support | Performance Tuning | Incident Analysis Consulting
📖 PDF eBook (Gumroad):
Zabbix Enterprise Optimization Handbook
A single, production-ready PDF that compiles my in-depth Zabbix and Kubernetes monitoring guides.
답글 남기기
댓글을 달기 위해서는 로그인해야합니다.