1. Assumptions and Goal of This Part
Assumptions
- Suricata is already running on the NAT Instance.
- Install the entire ELK stack on the same NAT Instance.
- Architecture :
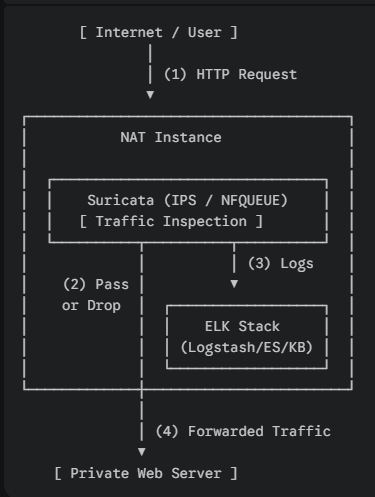
Goal
Finish everything in this part.
On the NAT Instance:
- Install and start Elasticsearch
- Install Kibana and verify access
- Install Logstash
Do not integrate logs yet.
→ Part 6 covers Logstash filters and full processing of Suricata eve.json.
2. NAT Instance Sizing and Notes
Minimum Specs (Lab)
- Instance type: minimum
t3.medium/ recommended:t3.xlarge t3.smallor lower → Elasticsearch may bottleneck.- RAM: 4 GB or more
- Disk: 20 GB or more
Running Suricata IPS and ELK on a single instance is for lab purposes only.
Do not do this in production environments.
3. Kernel Parameter (Required)
Elasticsearch will warn or fail to start without this.
root@nat:/home/ubuntu# sysctl vm.max_map_countSet it:
# echo "vm.max_map_count=262144" > /etc/sysctl.d/99-elasticsearch.conf
# sysctl --system
# sysctl vm.max_map_count
4. Register the Elastic APT Repository
# apt update
# apt install -y curl gnupg apt-transport-https ca-certificates

# wget -qO - https://artifacts.elastic.co/GPG-KEY-elasticsearch \
| gpg --dearmor -o /usr/share/keyrings/elastic-keyring.gpg

# echo \
"deb [signed-by=/usr/share/keyrings/elastic-keyring.gpg] \
https://artifacts.elastic.co/packages/8.x/apt stable main" \
> /etc/apt/sources.list.d/elastic-8.x.list

# apt update
5. Elasticsearch Installation and Configuration
5.1 Install
# apt install -y elasticsearch5.2 Elasticsearch Configuration (Single Node)
# vi /etc/elasticsearch/elasticsearch.ymlSet only the following values:
Uncomment:
cluster.name: suricata-lab
node.name: nat-elk-1
network.host: 0.0.0.0
http.port: 9200
Add:
discovery.type: single-nodeBecause this is a NAT Instance, 0.0.0.0 binding is used.
Instead, do not expose port 9200 publicly in the security group.
5.3 JVM Heap Configuration (Important)
💡 Why not edit the main file (jvm.options)?
There is a main configuration file at /etc/elasticsearch/jvm.options.
But if you edit it directly, updates can overwrite it or cause conflicts later.
That is why jvm.options.d exists: add your own file there and Elasticsearch will load it automatically.
Create the file:
# vi /etc/elasticsearch/jvm.options.d/heap.optionsFor 4 GB RAM:
-Xms1g
-Xmx1g
5.4 Start Elasticsearch
# systemctl daemon-reload
# systemctl enable --now elasticsearch
Check status:
# systemctl status elasticsearch[Troubleshooting] Elasticsearch 8.x Startup Failure and Configuration Conflict
1. Symptom
Elasticsearch service fails to start (systemctl start elasticsearch → Job for elasticsearch.service failed).
journalctl shows a failure with exit code 1.
2. Log Analysis
Check the tail of the main log file to identify the root cause.
Command:
# tail -n 50 /var/log/elasticsearch/<cluster_name>.logExample:
# tail -n 50 /var/log/elasticsearch/suricata-lab.logKey error:
java.lang.IllegalArgumentException: setting [cluster.initial_master_nodes] is not allowed when [discovery.type] is set to [single-node]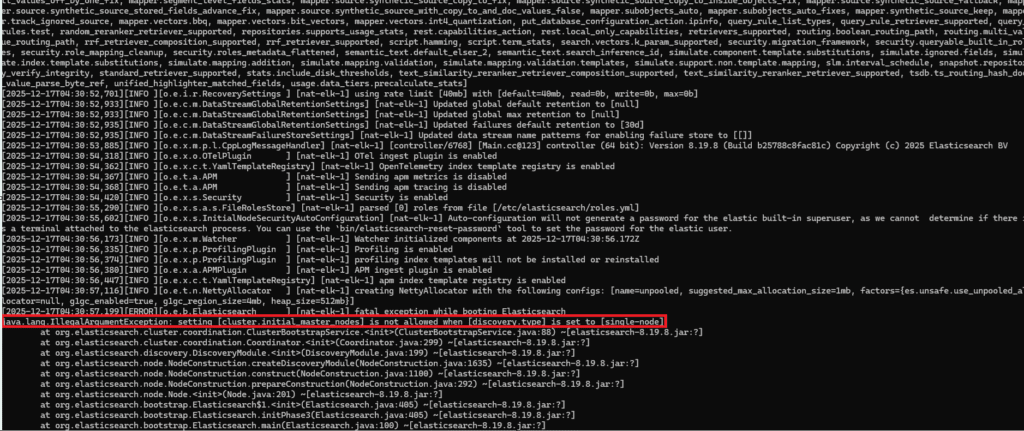
3. Root Cause
Configuration conflict: single-node mode and initial_master_nodes cannot exist together.
Auto-configuration behavior: even if you set only single-node, Elasticsearch 8.x may append cluster.initial_master_nodes to elasticsearch.yml during first boot as part of security auto-configuration by detecting the current hostname (for example, suricata).
This creates an unintended configuration conflict and blocks startup.
4. Fix
Disable the auto-added cluster.initial_master_nodes line.
1) Edit the config file:
# vi /etc/elasticsearch/elasticsearch.yml2) Comment out the conflicting line (usually added near the bottom):
Before (error):
cluster.initial_master_nodes: ["suricata"]
discovery.type: single-node
After (fixed):
# cluster.initial_master_nodes: ["suricata"]
discovery.type: single-node
3) Restart and verify:
# systemctl enable --now elasticsearch5.5 Set the elastic User Password
Elastic 8.x has security enabled by default.
# /usr/share/elasticsearch/bin/elasticsearch-reset-password -u elastic
Save the generated password.
5.6 Verify Elasticsearch
# curl -k https://localhost:9200
# curl -k -u elastic https://localhost:9200
6. Kibana Installation and Setup
6.1 Install Kibana
# apt install -y kibana6.2 Kibana Configuration
# vi /etc/kibana/kibana.ymlSet:
server.host: "0.0.0.0"
server.port: 5601
6.3 Generate a Kibana Enrollment Token
# /usr/share/elasticsearch/bin/elasticsearch-create-enrollment-token -s kibana6.4 Start Kibana
# systemctl enable --now kibana
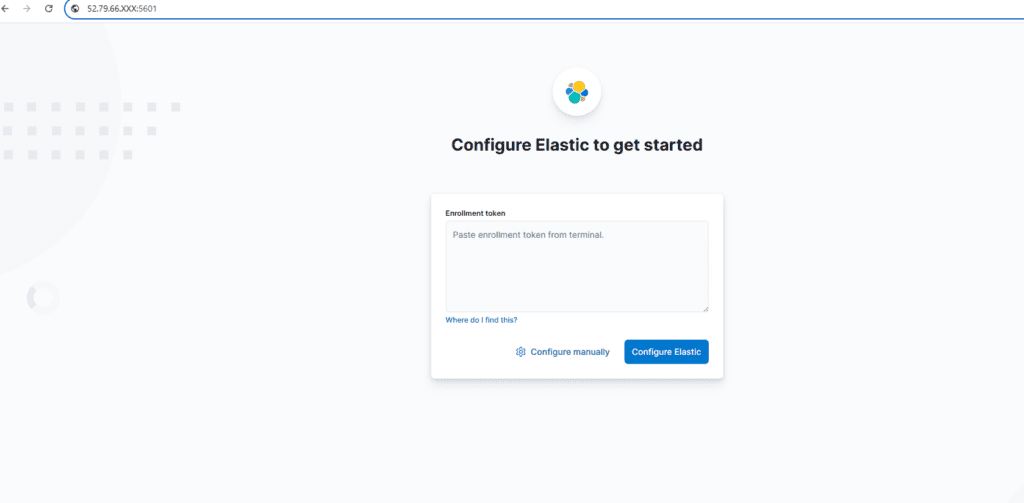
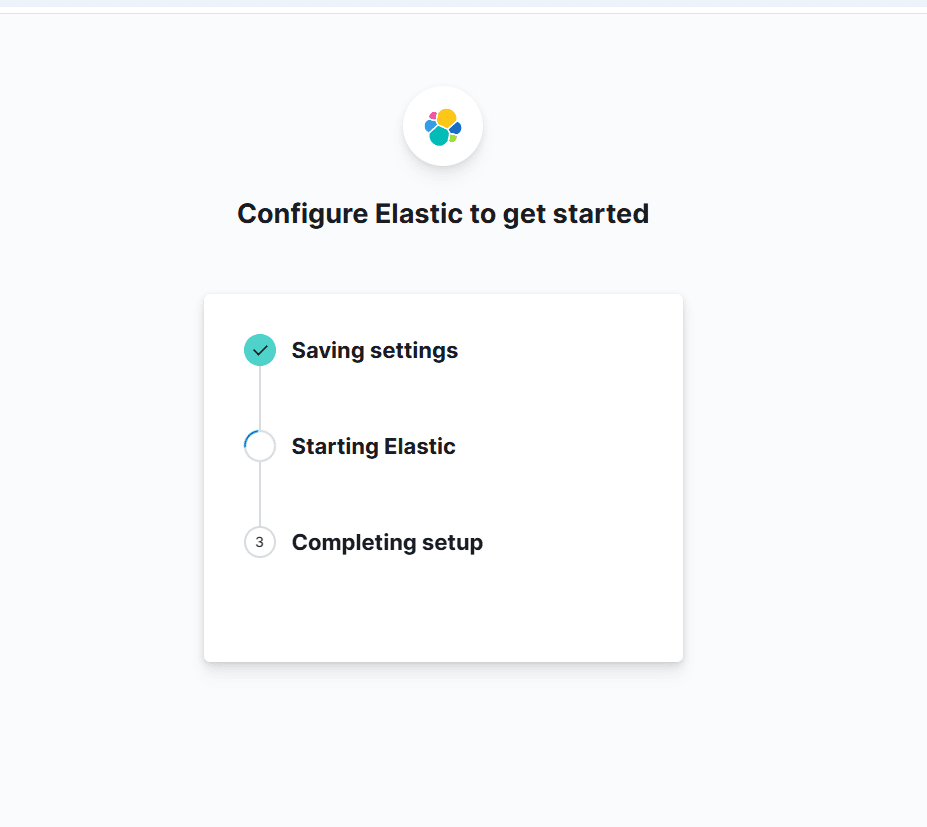
# systemctl status kibana6.5 Access Kibana
Open the following URL in a browser and paste the token generated above.
http://<NAT_PUBLIC_IP>:5601Order:
- Enter the enrollment token
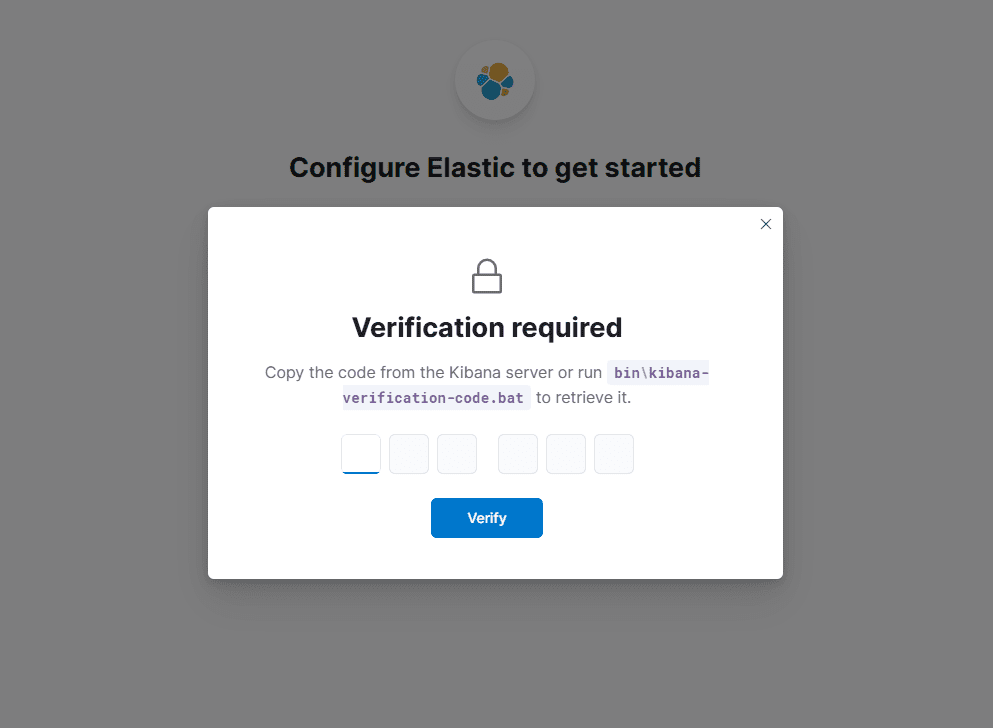
- Enter the verification code: run the command below and paste the output code.
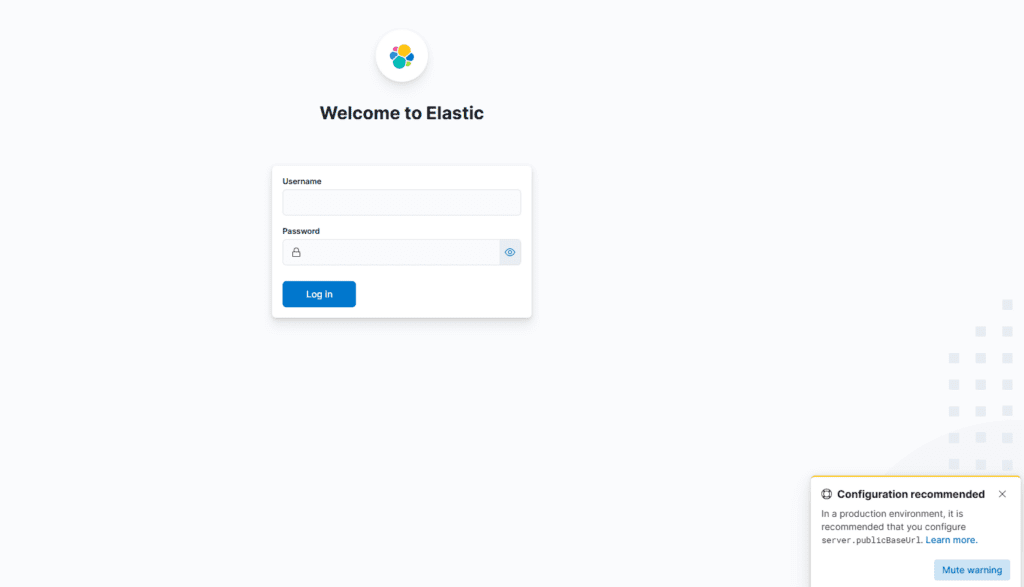
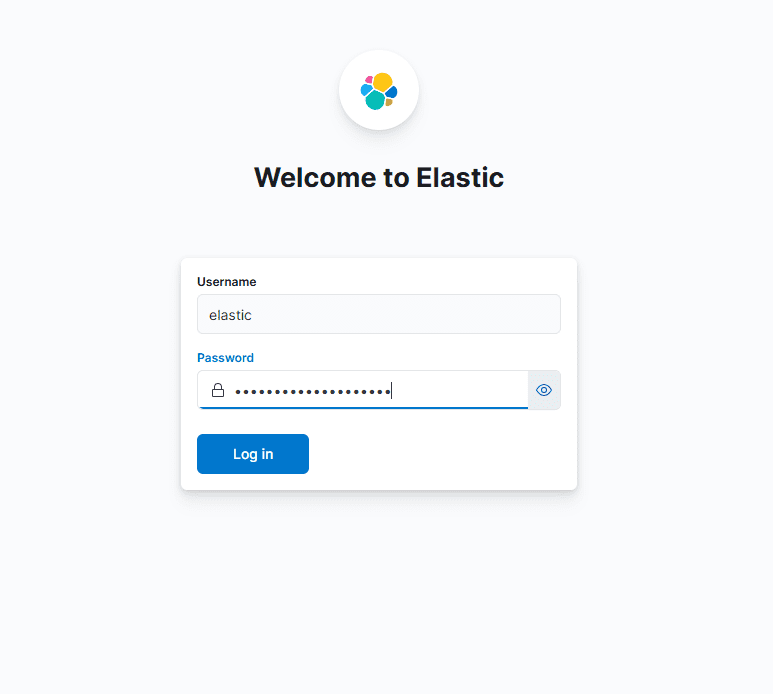
# /usr/share/kibana/bin/kibana-verification-codeLogin:
- user:
elastic - password: the
elasticpassword created earlier

7. Logstash Installation
In this part, only install and start the service.
# apt install -y logstash

# systemctl enable --now logstash
# systemctl status logstash
8. Final Checklist
# systemctl is-active elasticsearch
# systemctl is-active kibana
# systemctl is-active logstash
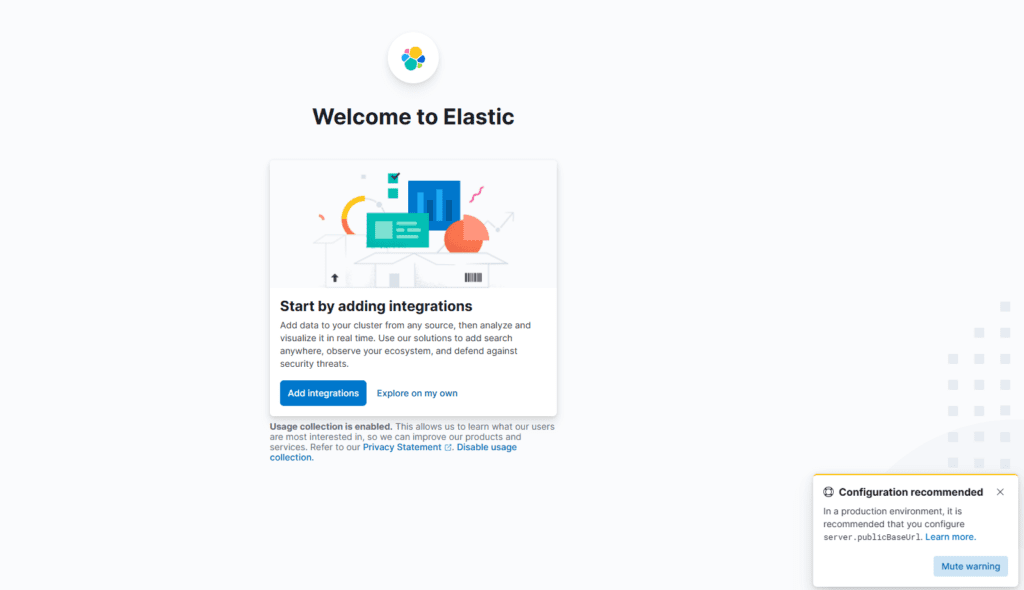
# ss -lntp | egrep '9200|5601'Verify Kibana access:
- Management screen loads normally
Part 6 Preview
- Suricata
eve.json→ Logstash input - Filters:
- Distinguish alert vs drop
- Extract and normalize
rule.sid/msg/src_ip/dest_ip
- Elasticsearch index design
- Kibana dashboards:
- Alert vs Drop
- Top attacker IPs
- Rule hit ranking, etc.
🛠 마지막 수정일: 2025.12.26
ⓒ 2026 엉뚱한 녀석의 블로그 [quirky guy's Blog]. All rights reserved. Unauthorized copying or redistribution of the text and images is prohibited. When sharing, please include the original source link.
💡 도움이 필요하신가요?
Zabbix, Kubernetes, 그리고 다양한 오픈소스 인프라 환경에 대한 구축, 운영, 최적화, 장애 분석,
광고 및 협업 제안이 필요하다면 언제든 편하게 연락 주세요.
📧 Contact: jikimy75@gmail.com
💼 Service: 구축 대행 | 성능 튜닝 | 장애 분석 컨설팅
📖 E-BooK [PDF] 전자책 (Gumroad):
Zabbix 엔터프라이즈 최적화 핸드북
블로그에서 다룬 Zabbix 관련 글들을 기반으로 실무 중심의 지침서로 재구성했습니다.
운영 환경에서 바로 적용할 수 있는 최적화·트러블슈팅 노하우까지 모두 포함되어 있습니다.
💡 Need Professional Support?
If you need deployment, optimization, or troubleshooting support for Zabbix, Kubernetes,
or any other open-source infrastructure in your production environment, or if you are interested in
sponsorships, ads, or technical collaboration, feel free to contact me anytime.
📧 Email: jikimy75@gmail.com
💼 Services: Deployment Support | Performance Tuning | Incident Analysis Consulting
📖 PDF eBook (Gumroad):
Zabbix Enterprise Optimization Handbook
A single, production-ready PDF that compiles my in-depth Zabbix and Kubernetes monitoring guides.
답글 남기기
댓글을 달기 위해서는 로그인해야합니다.