Installing Suricata and Configuring NFQUEUE-Based Inline Processing on a NAT Instance
In this section, we will install Suricata on a NAT Instance and configure an NFQUEUE-based inline processing architecture.
One important point: at this stage, no packet dropping is performed.
There is only one goal.
Ensure that packets must pass through Suricata, are properly analyzed, and that eve.json logs are generated correctly.
1. Suricata Installation (Ubuntu)
1.1 Install Suricata
# apt -y install suricata suricata-updateAfter installation, verify that Suricata was installed correctly by checking the version.
# suricata -VIf version information is displayed, the installation is successful.
1.2 Rule Download / Update
# suricata-updateThis uses Emerging Threats Open rules.
At this stage:
- Only
alertrules are used droprules are not applied yet
2. Basic Suricata Configuration
Configuration file path:
/etc/suricata/suricata.yaml2.1 HOME_NET Configuration
In Suricata, HOME_NET defines the protected network.
In a NAT Instance architecture, this must be set to the Private Subnet CIDR.
# grep -n "HOME_NET" /etc/suricata/suricata.yaml | headEdit the file and configure it as follows:
vars:
  address-groups:
    HOME_NET: "[10.0.1.0/24]"
    EXTERNAL_NET: "!$HOME_NET"
Notes:
- Do not include the NAT Instance public IP range
- The actual protected targets are the servers inside the Private Subnet
- If
HOME_NETis configured incorrectly, rules may trigger but the detection is meaningless
2.2 Verify eve.json Logging
Suricata event logs are written to eve.json.
In many cases it is enabled by default, but it must be verified.
# grep -n "eve-log" /etc/suricata/suricata.yaml | head -n 40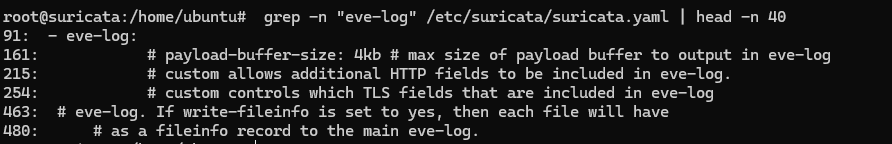
This configuration must exist for the following file to be created:
/var/log/suricata/eve.jsonThis log is the core data source for later OpenSearch / Kibana integration.
3. Running Suricata
3.1 Test Run Before systemd Execution
Always perform a test run before applying the configuration.
# suricata -T -c /etc/suricata/suricata.yamlThis step verifies:
- YAML syntax errors
- Rule parsing errors
- Configuration conflicts
If the output indicates success, the configuration is valid.

If errors occur here, the daemon will fail immediately when started.
3.2 Stop Existing Daemon (Prevent Conflicts)
The Suricata systemd service may already be running after package installation.
To avoid conflicts with NFQUEUE inline execution, stop and disable it first.
# systemctl stop suricata
# systemctl disable suricata
4. NFQUEUE-Based Inline Execution
4.1 Run Suricata
# suricata -c /etc/suricata/suricata.yaml -q 0 -DThe -q 0 option is critically important.
4.2 Meaning of -q 0: Using NFQUEUE Number 0
-q 0 (or iptables --queue-num 0) specifies the queue number agreed upon between the Linux kernel and Suricata for packet exchange.
1) Analogy: A Bank Counter
- iptables (security guard)
→ “This packet goes to counter number 0 for inspection” - Queue 0 (waiting line)
→ Packet waiting area - Suricata (bank clerk)
→ “I only handle counter number 0” (-q 0)
The key point:
If iptables sends packets to queue 0
but Suricata listens on queue 1 (-q 1),
the packets are not processed
and traffic stops.
Queue numbers must match exactly.
2) Technical Meaning (User-Space Packet Queuing)
Normally, packet processing happens in kernel space.
NFQUEUE sends packets to user space (Suricata).
Processing flow:
- Kernel sends packet to NFQUEUE 0
- Suricata monitors queue 0
- Packet inspection is performed
- Result is returned to the kernel
Possible outcomes:
- ACCEPT
- DROP
3) Why Queue 0?
There is no special meaning.
It is simply a conventional default.
In high-performance environments, this can be expanded:
# iptables --queue-balance 0:3
# suricata -q 0 -q 1 -q 2 -q 3
This enables multi-queue, multi-core processing.
This lab does not use this configuration.
(3) Current Queue State
- iptables → NFQUEUE 0
- Suricata → listening on
-q 0 - Queue numbers match
- Inline processing works correctly
5. Log Verification
Verify Suricata operation via logs.
# tail -f /var/log/suricata/suricata.log
# tail -f /var/log/suricata/eve.json- When traffic flows, events are written to
eve.json - When alert rules match, logs accumulate
6. Conclusion
The current state is as follows:
- NFQUEUE-based inline processing is active
- All packets pass through Suricata
- Rule actions are primarily
alert - No actual blocking (
drop) occurs
In other words:
Inline IDS mode
Packet blocking only occurs when rule actions are set to drop.
In production environments, it is perfectly appropriate to operate in this observation-only state first, remove false positives, and then convert only necessary rules to drop.
🛠 마지막 수정일: 2025.12.24
ⓒ 2026 엉뚱한 녀석의 블로그 [quirky guy's Blog]. All rights reserved. Unauthorized copying or redistribution of the text and images is prohibited. When sharing, please include the original source link.
💡 도움이 필요하신가요?
Zabbix, Kubernetes, 그리고 다양한 오픈소스 인프라 환경에 대한 구축, 운영, 최적화, 장애 분석,
광고 및 협업 제안이 필요하다면 언제든 편하게 연락 주세요.
📧 Contact: jikimy75@gmail.com
💼 Service: 구축 대행 | 성능 튜닝 | 장애 분석 컨설팅
📖 E-BooK [PDF] 전자책 (Gumroad):
Zabbix 엔터프라이즈 최적화 핸드북
블로그에서 다룬 Zabbix 관련 글들을 기반으로 실무 중심의 지침서로 재구성했습니다.
운영 환경에서 바로 적용할 수 있는 최적화·트러블슈팅 노하우까지 모두 포함되어 있습니다.
💡 Need Professional Support?
If you need deployment, optimization, or troubleshooting support for Zabbix, Kubernetes,
or any other open-source infrastructure in your production environment, or if you are interested in
sponsorships, ads, or technical collaboration, feel free to contact me anytime.
📧 Email: jikimy75@gmail.com
💼 Services: Deployment Support | Performance Tuning | Incident Analysis Consulting
📖 PDF eBook (Gumroad):
Zabbix Enterprise Optimization Handbook
A single, production-ready PDF that compiles my in-depth Zabbix and Kubernetes monitoring guides.
답글 남기기
댓글을 달기 위해서는 로그인해야합니다.