Ready to streamline your complex Zabbix operations?
I’ve distilled the most valuable insights from this blog into one essential guide. Take full control of your environment with the Zabbix 7 Enterprise Optimization Handbook [Mastering Hybrid Infrastructure Monitoring with a Kubernetes First Approach].
👉 Get your PDF copy here: https://jikimy.gumroad.com/l/zabbixmaster
Simply checking whether a site is “up” is not enough for reliable monitoring.
Even if the login page itself loads, users may still be unable to access the service if the actual login process fails.
By using Zabbix’s Web Scenario feature, you can simulate a real login request and verify the response to monitor whether login is truly successful.
While HTTP availability monitoring is straightforward—and plenty of guides exist online—guides that explain functional monitoring including login validation are much harder to find.
Below is a walkthrough of how this was implemented in a real environment.
1. Identify the Login URL and Payload
First, determine which URL the login request is sent to and what parameters are included.
This can be done easily using Chrome Developer Tools (F12):
- Open the login page → press F12 → go to the Network tab
- Apply the Fetch/XHR filter and click the login button
- Find the first
sign-inrequest and click it - Check the URL and Method (should be
POST) - Check Request Headers to confirm the
Content-Type - Inspect the Payload to see the fields being sent
Example (dummy values):
- URL:
https://example.com/member-user/auth/sign-in - Method:
POST - Content-Type:
multipart/form-data; boundary=----WebKitFormBoundary6x5o981HvBL2rDUC - Payload:
clientname: example username: test_user@example.com password: MySecurePassword123!
👉 Key points:
- clientname → identifies the service. This varies by site and must be checked.
- username → the actual login account. Use a dedicated monitoring account, not a real admin user.
- password → the password for that account.
2. Test with curl
Before applying to Zabbix, always test manually with curl.
curl -X POST https://example.com/member-user/auth/sign-in \
  -H "Content-Type: multipart/form-data; boundary=----WebKitFormBoundary6x5o981HvBL2rDUC" \
  -F "clientname=example" \
  -F "username=test_user@example.com" \
  -F "password=MySecurePassword123!"
- If the response is
200 OK→ it works. - If you get
401,403, or500→ either the URL, payload, or headers are incorrect.
Tip. If it doesn’t work correctly, try removing the -H option (Content-Type) to avoid boundary mismatches and let curl handle it automatically.
3. Configure Zabbix Web Scenario
(1) Scenario basics
- Name:
Login Check - URL:
https://example.com/member-user/auth/sign-in - Update interval and attempts: adjust as needed
- Agent:
Zabbix server
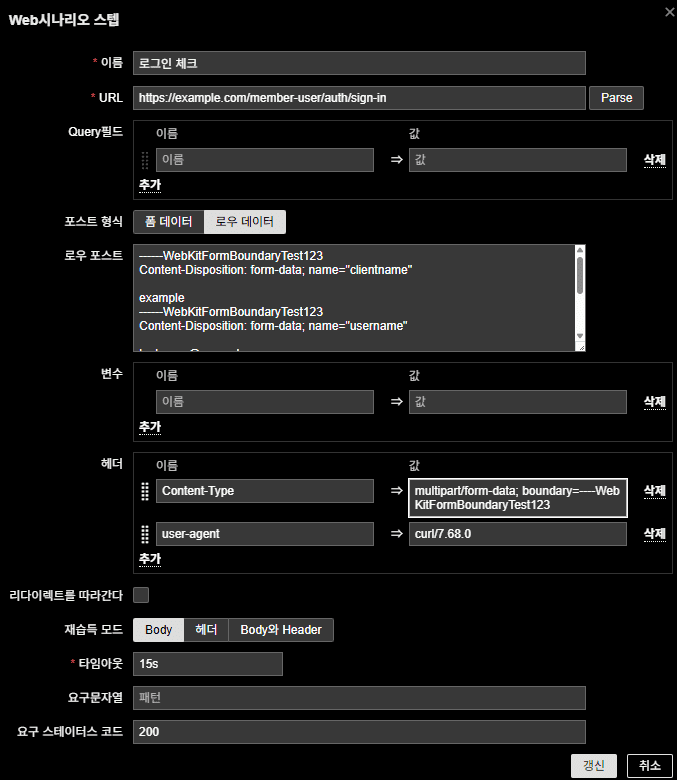
(2) Add a Step
- Name:
Login Attempt - URL: login processing URL from Developer Tools
- Post type:
Raw data
Raw post body (example):
------WebKitFormBoundaryTest123
Content-Disposition: form-data; name="clientname"

example
------WebKitFormBoundaryTest123
Content-Disposition: form-data; name="username"

test_user@example.com
------WebKitFormBoundaryTest123
Content-Disposition: form-data; name="password"

MySecurePassword123!
------WebKitFormBoundaryTest123--
👉 Important notes:
- Boundary string (
WebKitFormBoundaryTest123) → you can copy it from Developer Tools or create your own. - The boundary string must match exactly in both the header and the raw data body.
example,test_user@example.com, andMySecurePassword123!are just sample values—replace with your environment’s monitoring account.
(3) Add headers
Content-Type: multipart/form-data; boundary=----WebKitFormBoundaryTest123
user-agent: curl/7.68.0
Content-Typemust match the boundary used above.user-agentcan be arbitrary (curl,Mozilla/...).
(4) Timeout & status code
- Timeout: 15s (adjust for your environment)
- Required status code:
200
4. Login Method Considerations
This approach does not work in every case—login flows differ by implementation:
- Simple form login → ✅ Works exactly as shown
- Session cookie based → Requires at least 2 steps in Zabbix Web Scenario to follow cookies
- CSRF token required → Must extract and send the hidden token value as part of the payload
- JavaScript encryption or reCAPTCHA → ❌ Not possible with Web Scenario alone (requires API or custom integration)
5. Summary
- Use Chrome Developer Tools to capture the URL, headers, and payload.
- Test with curl to verify
200 OK. - Configure Zabbix Web Scenario with the same raw data and headers.
- Boundary values can be arbitrary but must match between body and header.
- For advanced login flows (session, CSRF, captcha), extra work or a different approach is required.
👉 With this, Zabbix goes beyond “HTTP is alive” checks and validates whether login is truly working.
Zabbix Web Scenario: Adding a Login Check Trigger
Once the Web Scenario is in place, you need a trigger so alerts are generated.
The key metric here is web.test.fail.
0→ Normal (login succeeded)1→ Problem (login failed)
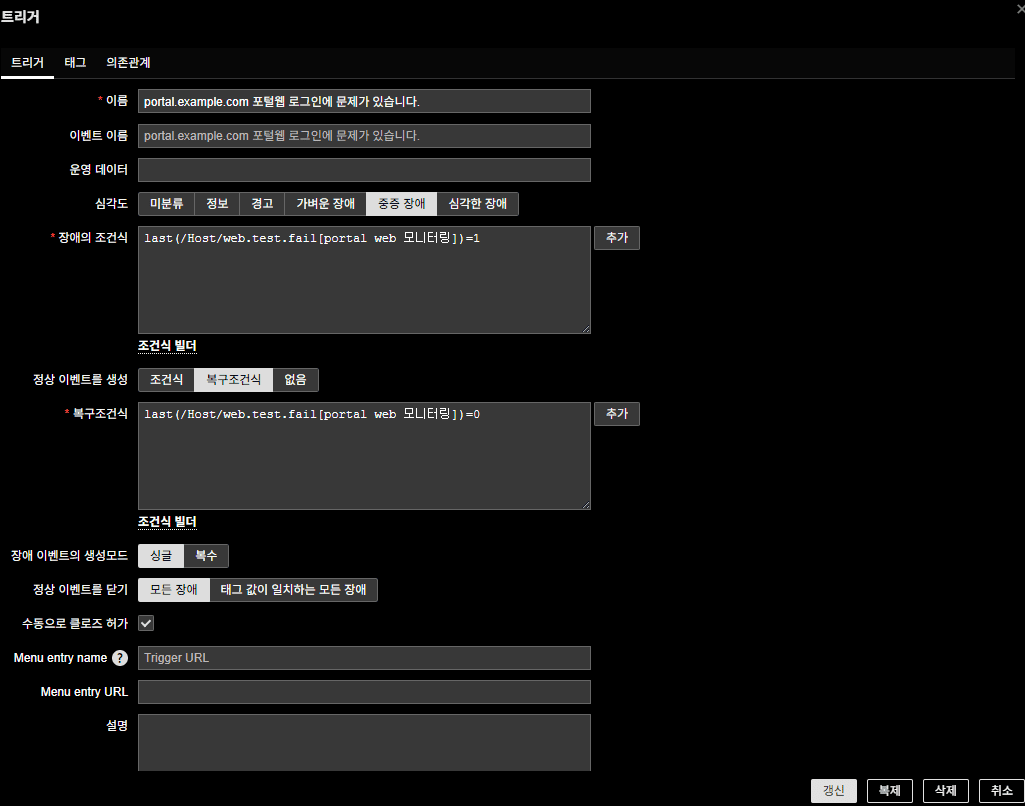
1. Trigger configuration
(1) Name
portal.example.com portal login has a problem
Clear naming helps operators immediately understand what failed.
(2) Problem expression
last(/Host/web.test.fail[portal web monitoring])=1
- Meaning: if the latest value is
1, the login failed → trigger fires.
(3) Recovery expression
last(/Host/web.test.fail[portal web monitoring])=0
- Meaning: if the latest value is
0, login is working again → trigger resolves.
(4) Severity
- Since login failure blocks all users, severity should be set to High or Critical.
2. Other trigger options
- OK event generation: based on recovery expression
- Problem event generation mode: Single
- Close OK events: All problems
- Allow manual close: optional
3. Final example
- Trigger name:
portal.example.com portal login has a problem - Problem condition:
last(/Host/web.test.fail[portal web monitoring])=1 - Recovery condition:
last(/Host/web.test.fail[portal web monitoring])=0 - Severity:
Critical
4. Summary
web.test.fail→0normal /1problem- Trigger expression:
=1for problem,=0for recovery - This ensures Zabbix alerts not only on HTTP availability, but on real login failures.
👉 With this setup, you’ll be notified immediately when users can’t log in—even if the site itself looks “up.”
🛠 마지막 수정일: 2025.12.12
ⓒ 2025 엉뚱한 녀석의 블로그 [quirky guy's Blog]. All rights reserved. Unauthorized copying or redistribution of the text and images is prohibited. When sharing, please include the original source link.
💡 도움이 필요하신가요?
Zabbix, Kubernetes, 그리고 다양한 오픈소스 인프라 환경에 대한 구축, 운영, 최적화, 장애 분석,
광고 및 협업 제안이 필요하다면 언제든 편하게 연락 주세요.
📧 Contact: jikimy75@gmail.com
💼 Service: 구축 대행 | 성능 튜닝 | 장애 분석 컨설팅
📖 E-BooK [PDF] 전자책 (Gumroad):
Zabbix 엔터프라이즈 최적화 핸드북
블로그에서 다룬 Zabbix 관련 글들을 기반으로 실무 중심의 지침서로 재구성했습니다.
운영 환경에서 바로 적용할 수 있는 최적화·트러블슈팅 노하우까지 모두 포함되어 있습니다.
💡 Need Professional Support?
If you need deployment, optimization, or troubleshooting support for Zabbix, Kubernetes,
or any other open-source infrastructure in your production environment, or if you are interested in
sponsorships, ads, or technical collaboration, feel free to contact me anytime.
📧 Email: jikimy75@gmail.com
💼 Services: Deployment Support | Performance Tuning | Incident Analysis Consulting
📖 PDF eBook (Gumroad):
Zabbix Enterprise Optimization Handbook
A single, production-ready PDF that compiles my in-depth Zabbix and Kubernetes monitoring guides.
답글 남기기
댓글을 달기 위해서는 로그인해야합니다.