Ready to streamline your complex Zabbix operations?
I’ve distilled the most valuable insights from this blog into one essential guide. Take full control of your environment with the Zabbix 7 Enterprise Optimization Handbook [Mastering Hybrid Infrastructure Monitoring with a Kubernetes First Approach].
👉 Get your PDF copy here: https://jikimy.gumroad.com/l/zabbixmaster
Background
My team is divided into three roles: Cloud Engineer, DevOps, and Data Engineer.
One day, a Data Engineer teammate requested: “I want to receive an alert when an Airflow DAG fails.”
You can check DAG execution status in the Airflow Web UI, but there was no direct way to receive failure alerts.
I found some Prometheus-based dashboard examples, but none focused specifically on failure alerts.
So in the end, I implemented it myself — Discovery → Item Prototype → Trigger Prototype.
This post explains how I monitored Airflow DAG status using Zabbix in an on-prem Kubernetes environment.
As long as Zabbix can communicate with the Airflow REST API, this method applies equally to on-prem Kubernetes, cloud environments, or VMs.
I will not describe Zabbix Agent or other general configurations here.
Why DAG alerts alone are not enough
A failed DAG is a problem, but the more fundamental issue is when Airflow itself stops functioning normally.
If the Scheduler stops, DAGs never start.
If the Metadata DB connection breaks, the whole system freezes.
If the Triggerer process dies, any event-based DAG won’t run at all.
In other words:
- DAG failure alerts = symptoms
- Airflow health alerts = root cause
You need both to detect issues quickly and respond properly.
Concept
- Periodically collect DAG IDs from the Airflow REST API.
- Query each DAG’s latest execution result from the API.
- If the latest execution is
failed, trigger a Zabbix alert.
1. Work on the Zabbix Server (Ubuntu)
1-1. Write a script to collect DAG IDs
The Zabbix server calls the Airflow API and retrieves the DAG ID list.
daginfo.sh — modify api_url, username, password, etc. according to your environment.
#!/bin/bash

API_URL="http://192.102.200.97:8080/api/v1/dags"
USERNAME="testuser"
PASSWORD="testpasswd"
LIMIT=100  # Maximum number of DAGs to fetch at once
OFFSET=0

OUT_FILE="/tmp/airflow_dag_ids.txt"
RESP_FILE="/tmp/airflow_response.json"

# Initialize the result file
> "$OUT_FILE"

while true; do
    # Call API with the current OFFSET and LIMIT
    HTTP_STATUS=$(
        curl -s -u "$USERNAME:$PASSWORD" \
             -o "$RESP_FILE" \
             -w "%{http_code}" \
             "${API_URL}?limit=${LIMIT}&offset=${OFFSET}"
    )

    # Check HTTP status code
    if [ "$HTTP_STATUS" -ne 200 ]; then
        echo "Error: Received HTTP status $HTTP_STATUS" >&2
        echo "Response content:" >&2
        cat "$RESP_FILE" >&2
        break
    fi

    # Extract only dag_id and append to the text file
    # (If the path changes, update it in the Zabbix master item as well)
    jq -r '.dags[].dag_id' "$RESP_FILE" >> "$OUT_FILE"

    # Check how many DAGs were in this page
    DAG_COUNT=$(jq '.dags | length' "$RESP_FILE")

    # Stop if there are no more DAGs
    if [ "$DAG_COUNT" -eq 0 ]; then
        break
    fi

    # Move to the next OFFSET
    OFFSET=$((OFFSET + LIMIT))
done

echo "All DAG IDs saved to $OUT_FILE"
Install jq:
apt install -y jq
Make executable:
chmod +x daginfo.sh
Run for the first time:
./daginfo.sh
Register in crontab (every 3 hours):
0 */3 * * * /home/example/daginfo.sh
2. Work in the Zabbix (7.4) UI
Prerequisite: Create a host group and host related to Airflow DAG monitoring.
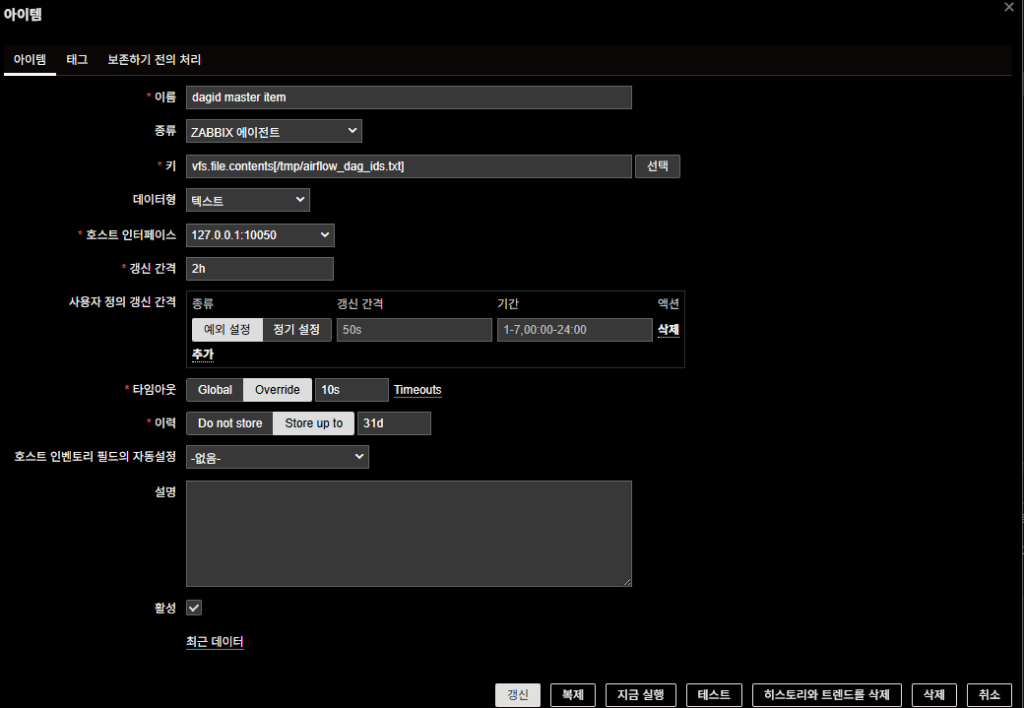
2-1. Create Master Item
- Name: dagid master item
- Key:
vfs.file.contents[/tmp/airflow_dag_ids.txt] - Type: Zabbix agent
- Type of information: Text
- Host Interface: 127.0.0.1:10050
- Update interval: 2h
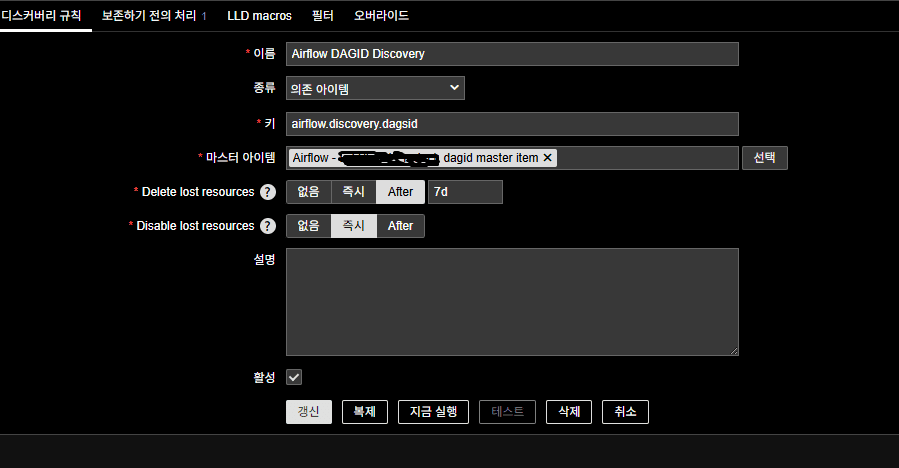
2-2. Create LLD (Discovery) Rule
Discovery is performed based on DAG ID list from the Master Item.
- Name: Airflow DAGID Discovery
- Type: Dependent item
- Key: airflow.discovery.dagsid (arbitrary)
- Master Item: the master item created above
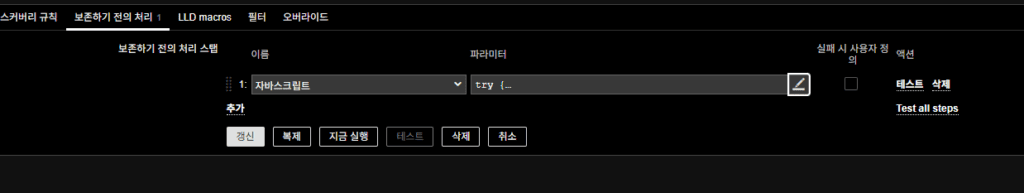
Preprocessing steps (JavaScript):
try {
    // Debug: print input value
    console.log("Input value received:", value);

    if (!value) {
        console.log("No value received or value is empty.");
        return JSON.stringify({ "data": [] });
    }

    // Split file content by line (Windows and Unix line breaks supported)
    var lines = value.split(/\r?\n/);

    // Array to store DAG ID objects
    var data = [];

    // Convert each non-empty line to JSON for LLD
    for (var i = 0; i < lines.length; i++) {
        var dag_id = lines[i].trim();
        if (dag_id) {
            data.push({ "{#DAG_ID}": dag_id });
            console.log("DAG ID added:", dag_id);
        } else {
            console.log("Empty line at index:", i);
        }
    }

    console.log("Total DAG IDs found:", data.length);

    // Return as JSON for LLD
    return JSON.stringify({ "data": data });

} catch (error) {
    console.log("Error in JavaScript preprocessing:", error);
    return JSON.stringify({ "data": [] });
}
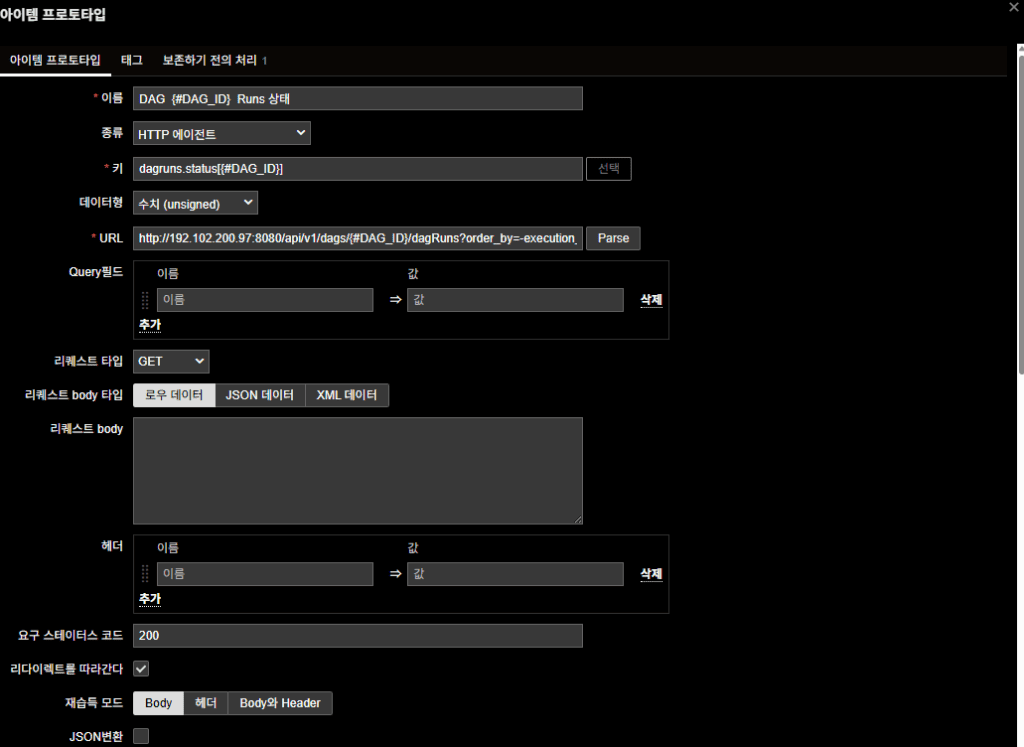
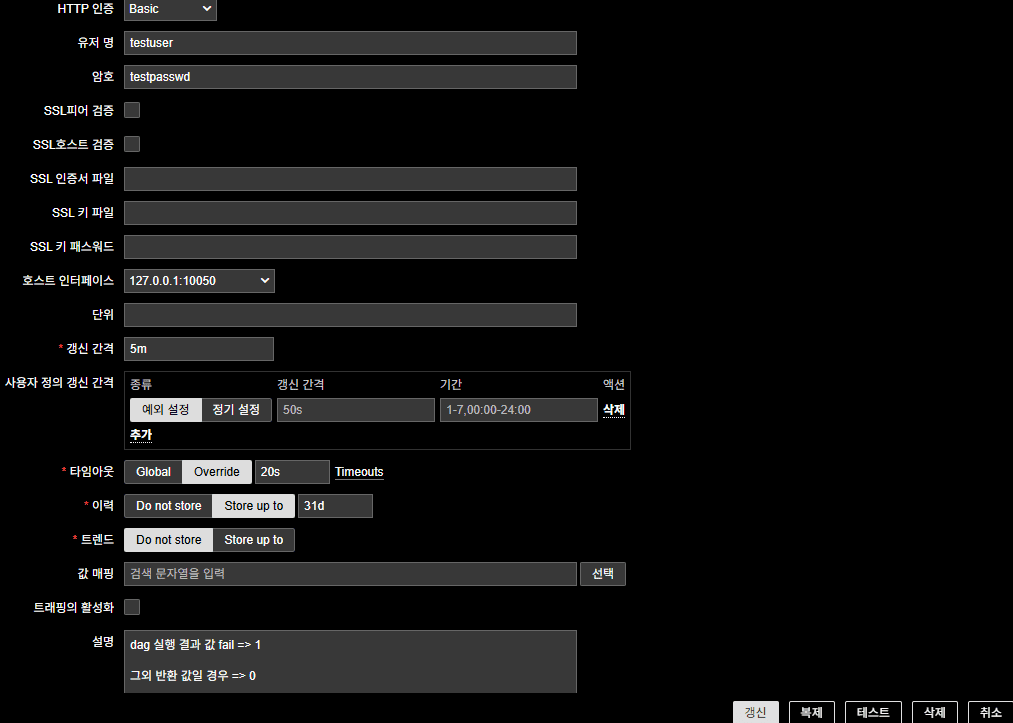
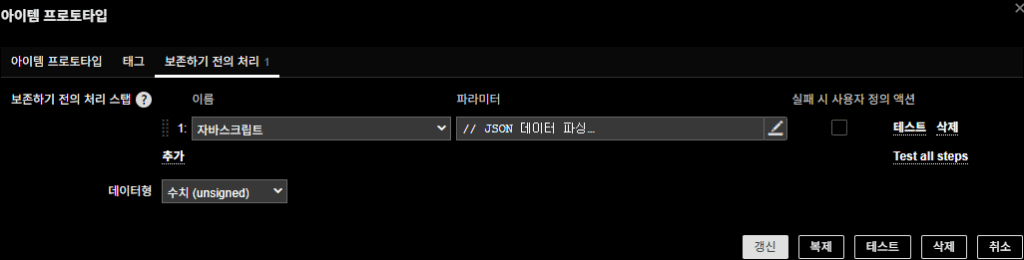
2-3. Create Item Prototype
Each DAG run status is checked via the REST API.
- Name: DAG {#DAG_ID} Runs Status
- Type: HTTP agent
- Key: dagruns.status[{#DAG_ID}]
- Type of information: Numeric (unsigned)
- URL:
http://192.102.200.97:8080/api/v1/dags/{#DAG_ID}/dagRuns?order_by=-execution_date
(Replace with your own API IP) - HTTP authentication: Basic (Airflow account)
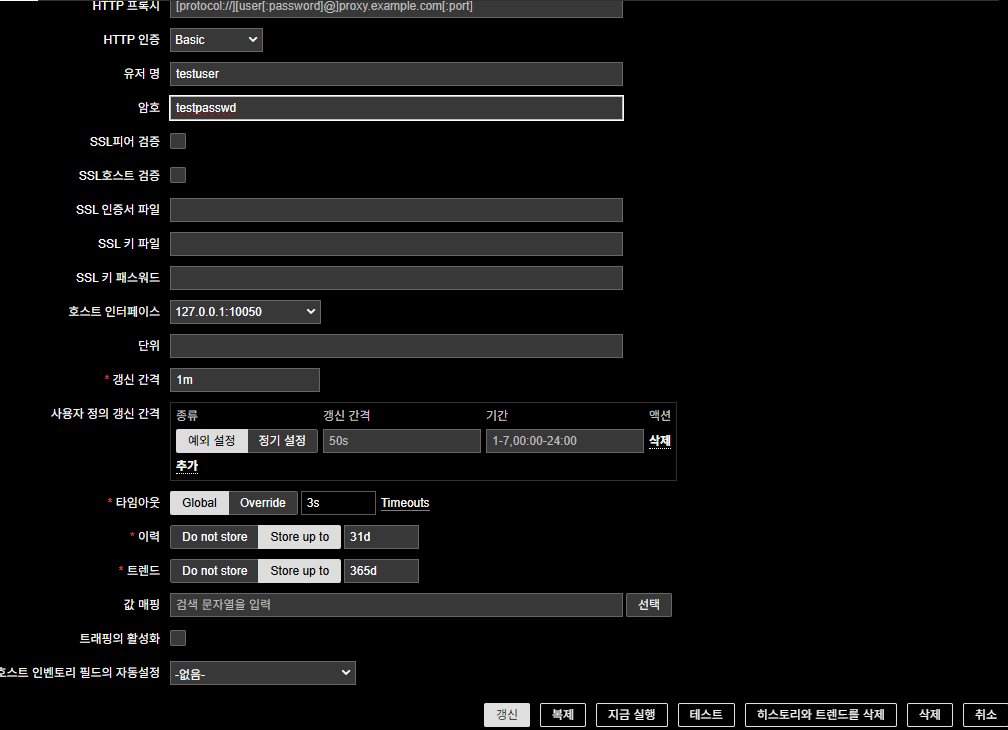
- Update interval: 5m
- Host interface: 127.0.0.1:10050
Preprocessing steps (JavaScript):
// Parse JSON
var parsedData;
try {
    parsedData = JSON.parse(value);
} catch (e) {
    throw "JSON parse error occurred";
}

// Extract the latest dagRun
if (parsedData.dag_runs && parsedData.dag_runs.length > 0) {
    var latestRun = parsedData.dag_runs[0];
    var state = latestRun.state;

    if (state === "failed") {
        return 1;
    } else if (state === "success" || state === "running") {
        return 0;
    } else {
        return 0;
    }
} else {
    // No run history
    return 0;
}
Return values
- failed → 1
- success/running → 0
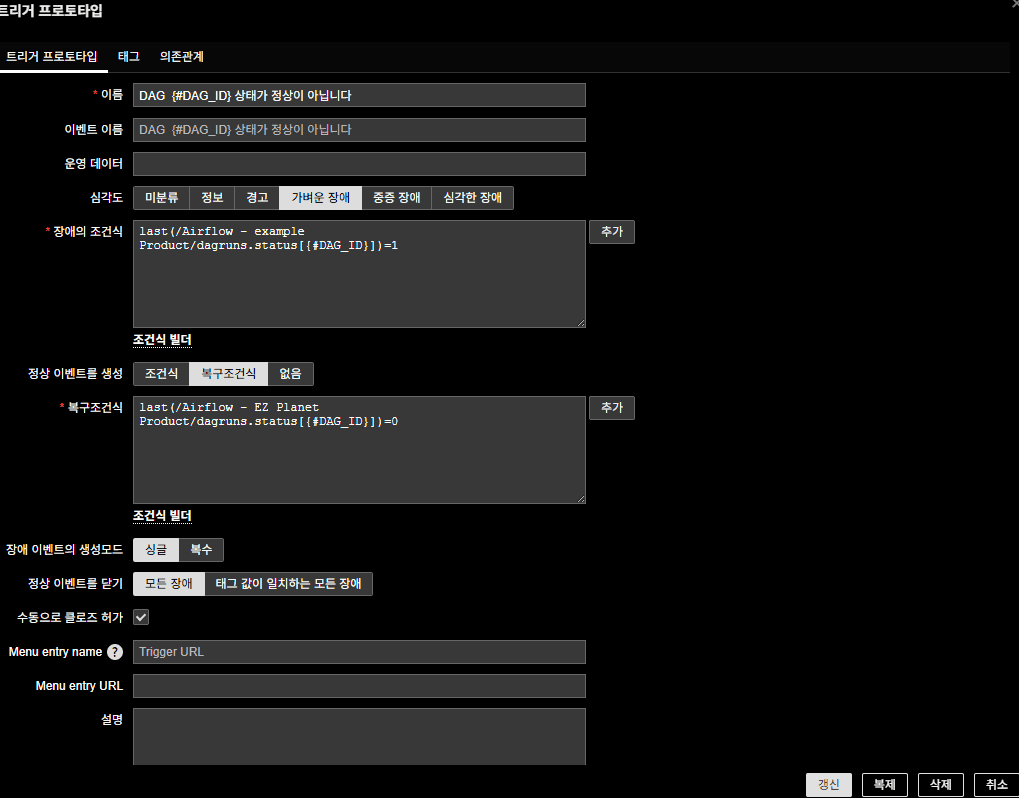
2-4. Create Trigger Prototype
Select the item prototype in both the Problem expression and the Recovery expression.
- Name: DAG {#DAG_ID} is not in a normal state
- Problem Expression:
last(/Airflow - example Product/dagruns.status[{#DAG_ID}])=1 - Recovery Expression:
last(/Airflow - example Product/dagruns.status[{#DAG_ID}])=0 - Severity: Average (adjust as needed)
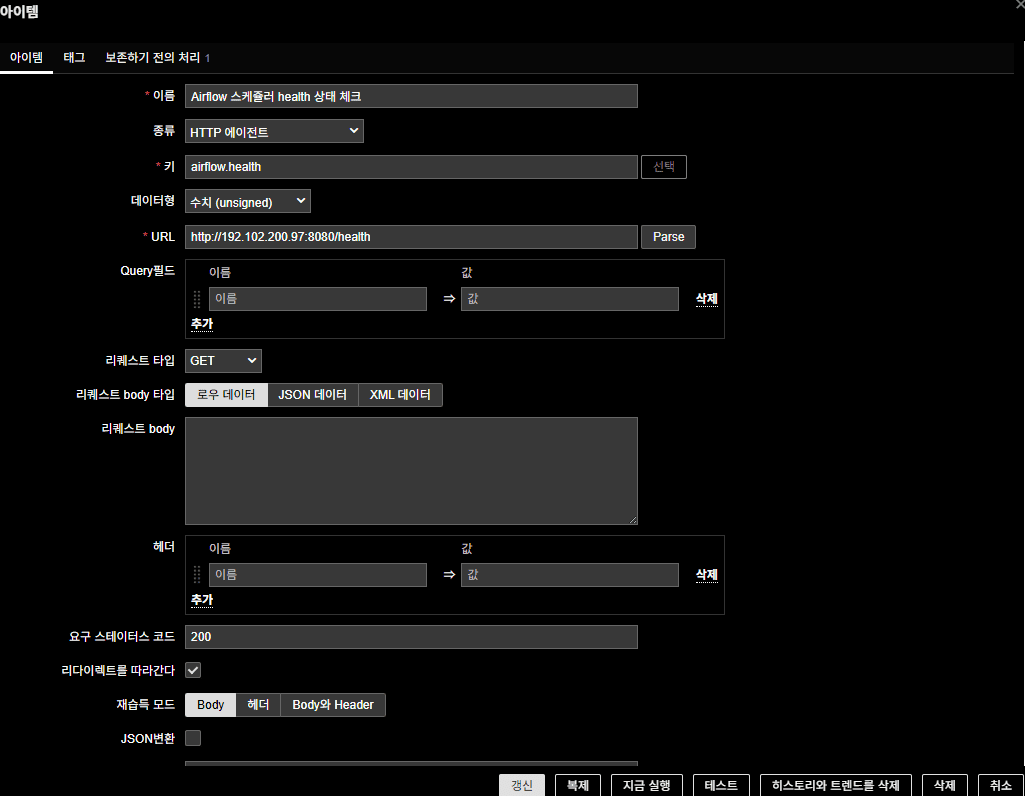
2-5. Create Airflow Health State Items
(Triggers omitted)
(1) Scheduler Health
- Name: Airflow Scheduler health check
- Type: HTTP agent
- Key: airflow.health
- Type of information : Numeric(unsigned)
- URL: http://192.102.200.97:8080/health
- Required status codes : 200
- HTTP authentication : Basic (Airflow account)
- Preprocessing steps (JavaScript)
JavaScript:
// Parse JSON
var parsedData;
try {
    if (!value) throw "Data is empty";
    parsedData = JSON.parse(value);
} catch (e) {
    return 1; // Treat JSON parse error as unhealthy
}

// Check scheduler status
if (parsedData.scheduler && parsedData.scheduler.status === "healthy") {
    return 0;
} else {
    return 1;
}
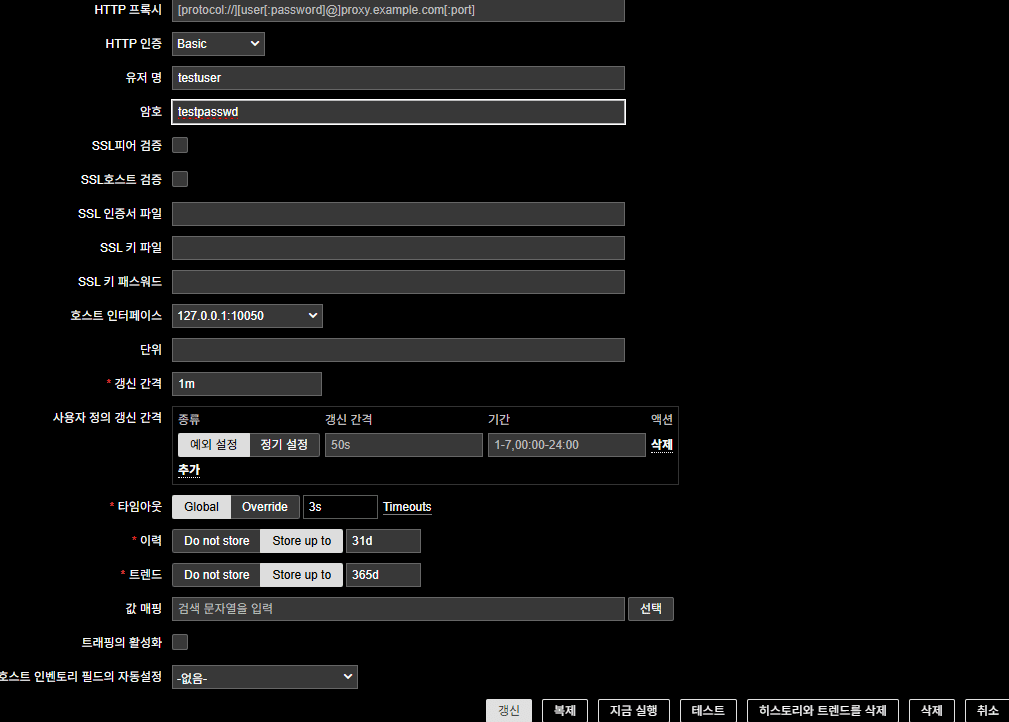
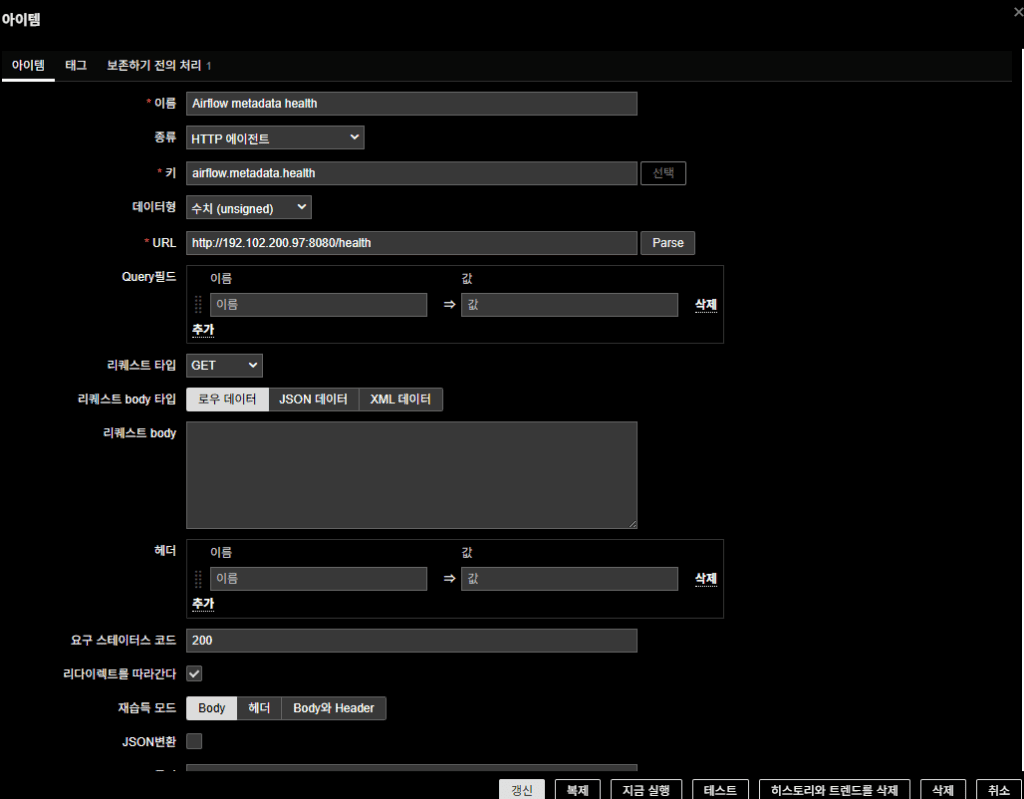
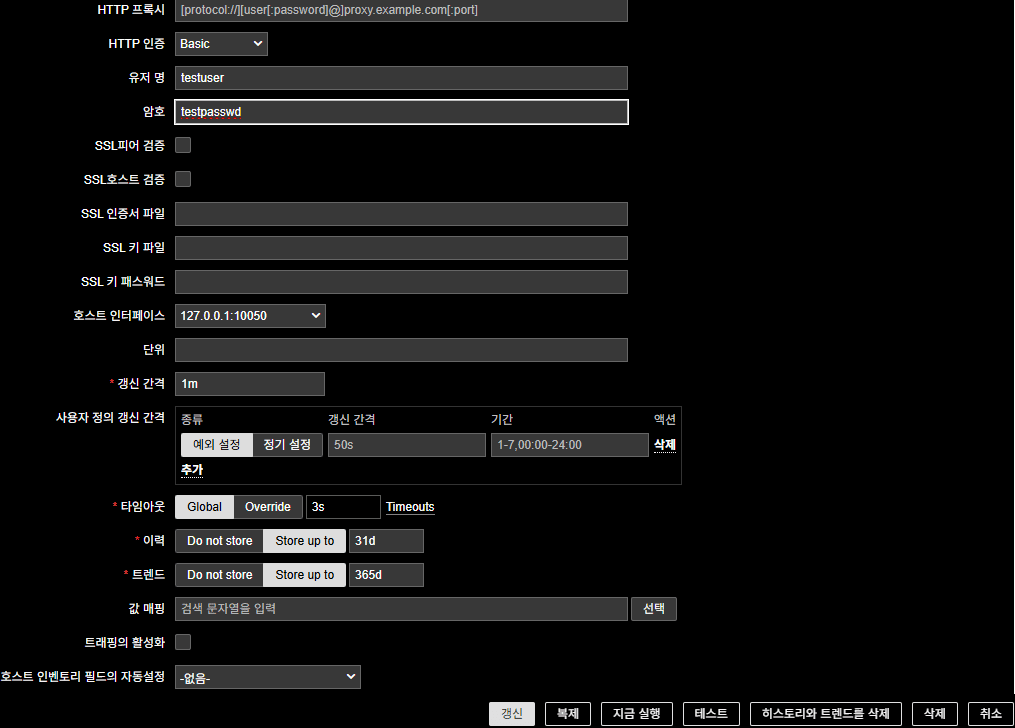
(2) Metadata DB Health
- Name: Airflow metadata health
- Type: HTTP agent
- Key: airflow.metadata.health
- Type of information : Numeric(unsigned)
- URL: http://192.102.200.97:8080/health
- Required status codes : 200
- HTTP authentication : Basic (Airflow account)
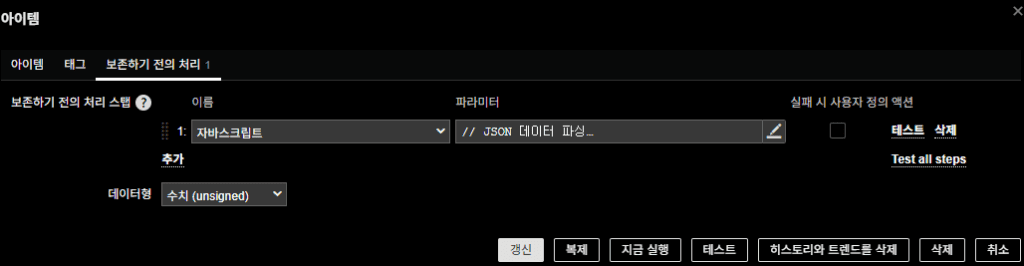
- Preprocessing steps (JavaScript)
JavaScript:
var parsedData;
try {
    if (!value) throw "Data is empty";
    parsedData = JSON.parse(value);
} catch (e) {
    return 1;
}

if (parsedData.metadatabase && parsedData.metadatabase.status === "healthy") {
    return 0;
} else {
    return 1;
}
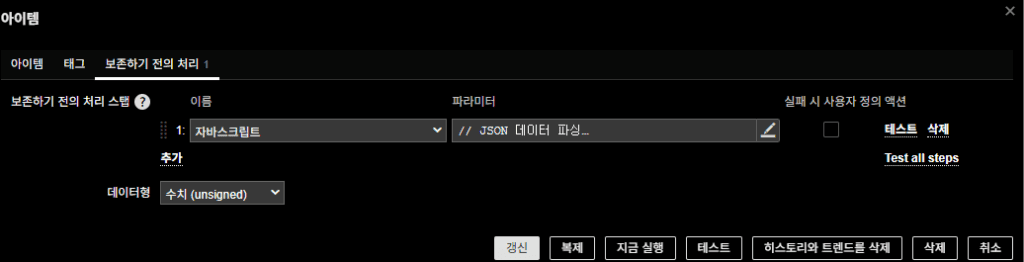
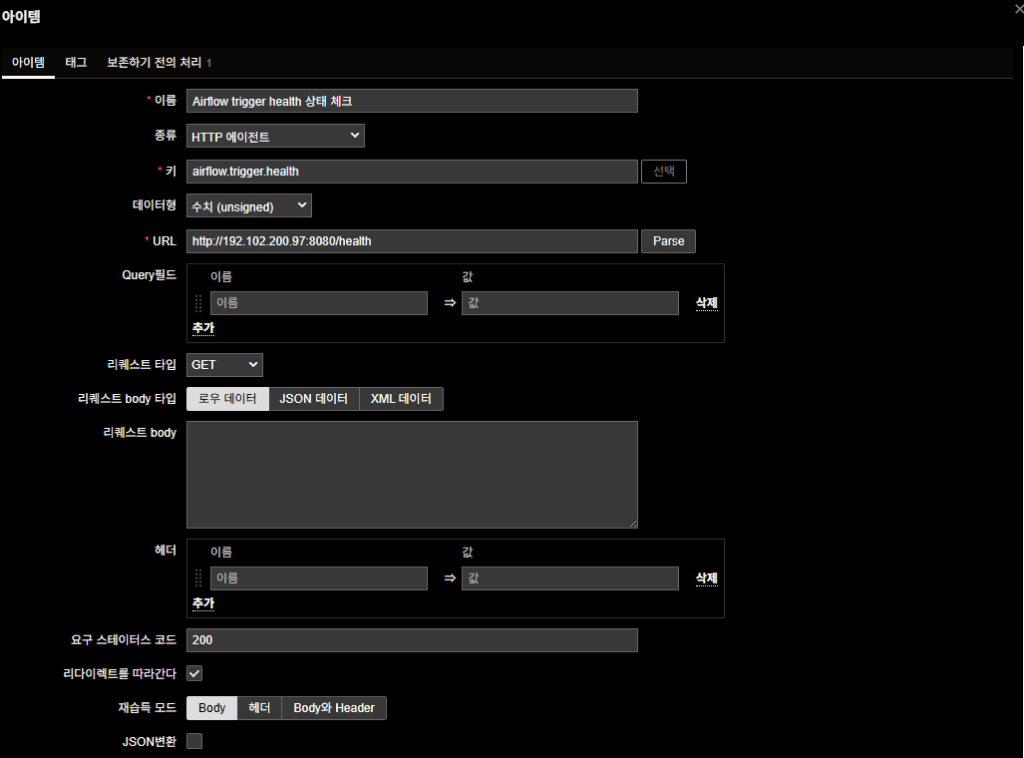
(3) Trigger Health
- Name: Airflow trigger health check
- Type: HTTP agent
- Key: airflow.trigger.health
- Type of information : Numeric(unsigned)
- URL: http://192.102.200.97:8080/health
- Required status codes : 200
- HTTP authentication : Basic (Airflow account)
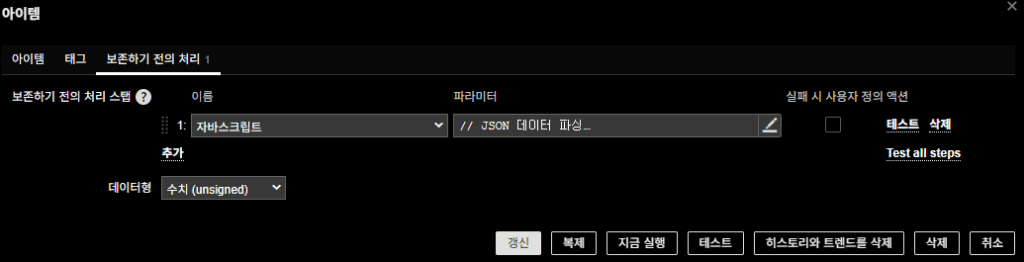
- Preprocessing steps (JavaScript)
JavaScript:
var parsedData;
try {
    if (!value) throw "Data is empty";
    parsedData = JSON.parse(value);
} catch (e) {
    return 1;
}

if (parsedData.triggerer && parsedData.triggerer.status === "healthy") {
    return 0;
} else {
    return 1;
}
Final Notes
Once this configuration is applied:
- Zabbix automatically retrieves DAG IDs via the Airflow REST API
- Checks each DAG’s latest execution result and generates alerts on failure
- Additionally monitors Scheduler / Metadata DB / Triggerer health
This means you get both:
- DAG failure alerts (symptoms)
- Airflow health alerts (root cause)
The environment described here is on-prem Kubernetes, but the method is universal.
As long as you can reach the Airflow REST API, it works on VMs, cloud, or managed services.
In scenarios like Airflow, what operators really need is not dashboards but instant alerts.
This method delivers exactly that.
🛠 마지막 수정일: 2025.12.12
ⓒ 2025 엉뚱한 녀석의 블로그 [quirky guy's Blog]. All rights reserved. Unauthorized copying or redistribution of the text and images is prohibited. When sharing, please include the original source link.
💡 도움이 필요하신가요?
Zabbix, Kubernetes, 그리고 다양한 오픈소스 인프라 환경에 대한 구축, 운영, 최적화, 장애 분석,
광고 및 협업 제안이 필요하다면 언제든 편하게 연락 주세요.
📧 Contact: jikimy75@gmail.com
💼 Service: 구축 대행 | 성능 튜닝 | 장애 분석 컨설팅
📖 E-BooK [PDF] 전자책 (Gumroad):
Zabbix 엔터프라이즈 최적화 핸드북
블로그에서 다룬 Zabbix 관련 글들을 기반으로 실무 중심의 지침서로 재구성했습니다.
운영 환경에서 바로 적용할 수 있는 최적화·트러블슈팅 노하우까지 모두 포함되어 있습니다.
💡 Need Professional Support?
If you need deployment, optimization, or troubleshooting support for Zabbix, Kubernetes,
or any other open-source infrastructure in your production environment, or if you are interested in
sponsorships, ads, or technical collaboration, feel free to contact me anytime.
📧 Email: jikimy75@gmail.com
💼 Services: Deployment Support | Performance Tuning | Incident Analysis Consulting
📖 PDF eBook (Gumroad):
Zabbix Enterprise Optimization Handbook
A single, production-ready PDF that compiles my in-depth Zabbix and Kubernetes monitoring guides.
답글 남기기
댓글을 달기 위해서는 로그인해야합니다.