Overview
I wrote about this topic before, but I wanted to provide a deeper, more practical walkthrough that could help readers set up production-level monitoring.
When using Zabbix to monitor Kubernetes, applying the Kubernetes Kubelet by HTTP template automatically creates host groups based on the macro {$KUBE.API.URL}.
The structure looks like this:
{$KUBE.API.URL} IP : Kubernetes/Components: Kubelet
This article explains how to visualize Pod CPU and Pod Memory usage in Grafana using that data.
If you’re unfamiliar with dashboard creation or variable setup, refer to the previous series:
🧭 Search for “Visualizing Zabbix Metrics with Grafana” in the search bar.
🧩 Visualizing Pod Memory
Target Group
Group: {$KUBE.API.URL} IP : Kubernetes/Components: Kubelet
Item tag: namespace — actual namespace name
Item example: Namespace [argocd] Pod [argocd-applicationset-controller-5867d7759-dksldk] Container [argocd-applicationset-controller]: Working set
This query retrieves the Pod Memory usage (Working set) metric.
Next, you’ll use variables to make the dashboard dynamic.
🧮 Creating Variables
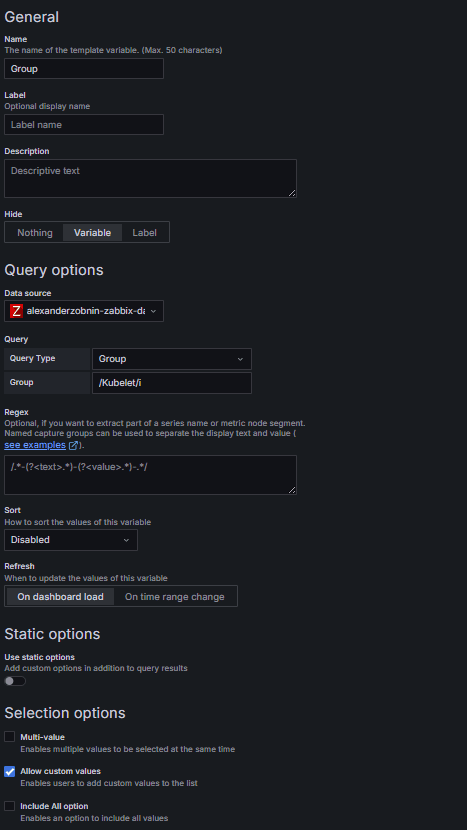
1️⃣ Group filter
| Setting | Value |
|---|---|
| Name | Group |
| Hide | Variable |
| Query Type | Group |
| Group | /Kubelet/i |
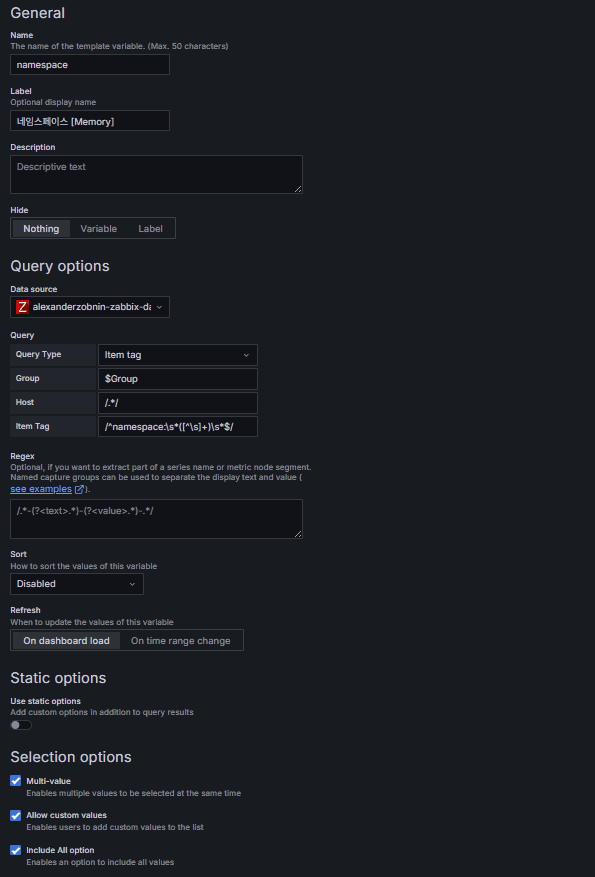
2️⃣ Item tag filter (namespace)
| Setting | Value |
|---|---|
| Name | namespace |
| Label | Namespace [Memory] |
| Query Type | item tag |
| Group | $Group |
| Host | /.*/ |
| Item Tag | /^namespace:\s*([^\s]+)\s*$/ |
| Multi-value | ✅ |
| Include All option | ✅ |
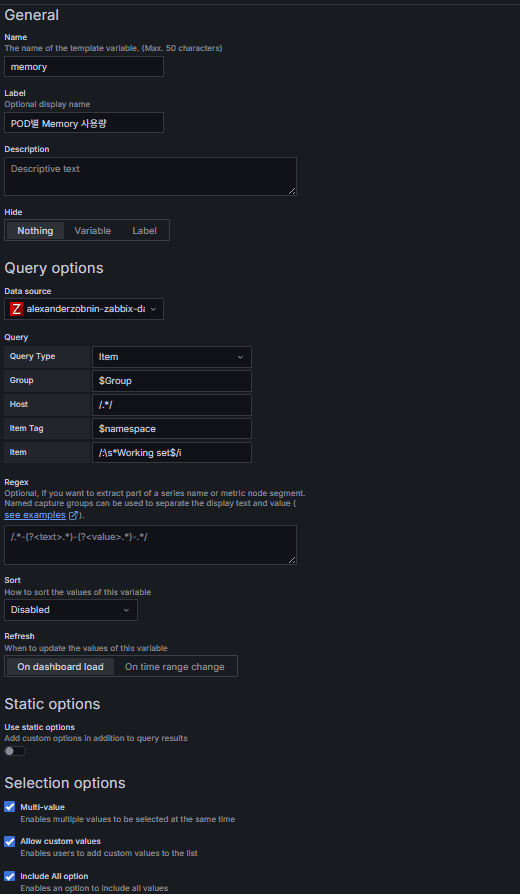
3️⃣ Item filter (Working set)
The Working set metric represents the actual memory usage per Pod.
| Setting | Value |
|---|---|
| Name | memory |
| Label | Pod Memory Usage |
| Query Type | item |
| Group | $Group |
| Host | /.*/ |
| Item Tag | $namespace |
| Item | /:\s*Working set$/i |
| Multi-value | ✅ |
| Include All option | ✅ |
💡 Tip
Sometimes, the Item Tag field in Query Options shows Application instead.
If that happens:
Home → Connections → Data Sources → Zabbix Datasource → Save & Test
This clears the Zabbix API cache.
If the issue persists, update the plugin and restart Grafana:
grafana-cli plugins update alexanderzobnin-zabbix-datasource
systemctl restart grafana-server
⚙️ Visualizing Pod CPU
Target Group
Group: {$KUBE.API.URL} IP : Kubernetes/Components: Kubelet
Item tag: component: pod
Item example: Namespace [argocd] Pod [argocd-applicationset-controller-5867d7759-dksldk]: CPU: Usage seconds, total
This query retrieves Pod CPU usage (Usage seconds, total).
You can configure variables for namespace- and pod-level dynamic analysis.
🧮 Creating Variables
1️⃣ Group filter
Reuse the Group variable from the previous step.
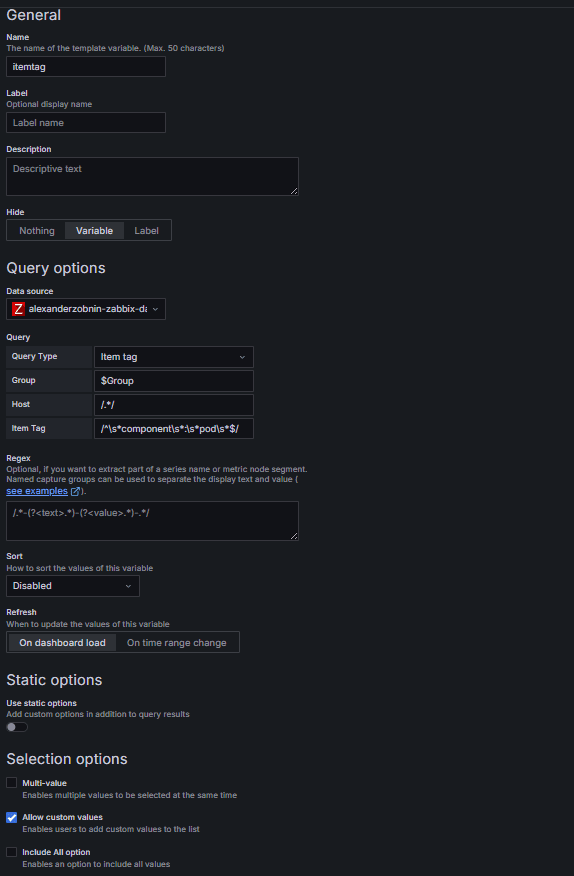
2️⃣ Item tag filter (component: pod)
| Setting | Value |
|---|---|
| Name | itemtag |
| Hide | Variable |
| Query Type | item tag |
| Group | $Group |
| Host | /.*/ |
| Item Tag | /^\s*component\s*:\s*pod\s*$/ |
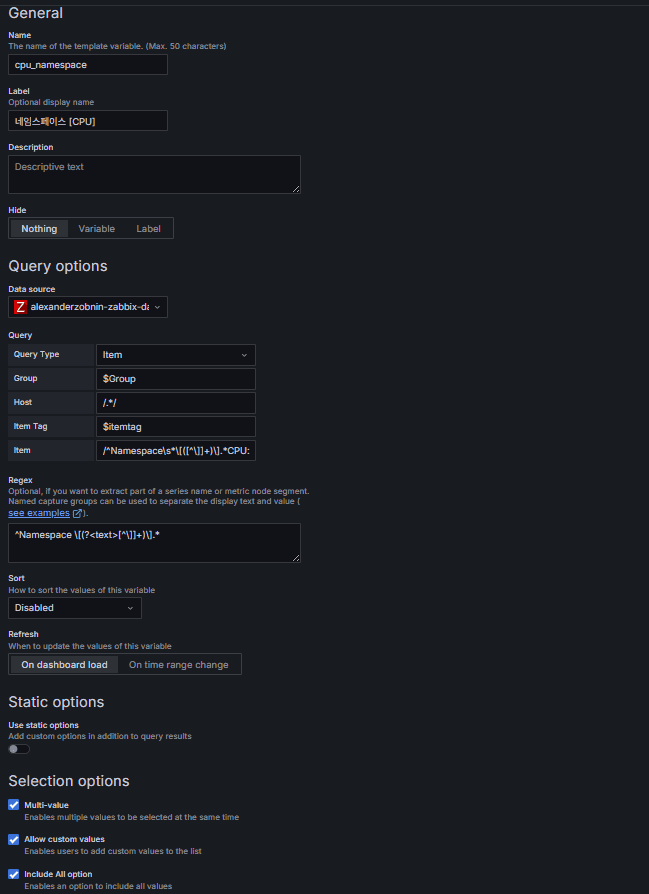
3️⃣ Item filter (for namespace classification)
Because CPU data is large and complex, create a namespace label for pre-classification.
| Setting | Value |
|---|---|
| Name | cpu_namespace |
| Label | Namespace [CPU] |
| Query Type | item |
| Group | $Group |
| Host | /.*/ |
| Item Tag | $itemtag |
| Item | /^Namespace\s*\[([^\]]+)\].*CPU: Usage seconds, total$/ |
| Regex | ^Namespace \[(?<text>[^\]]+)\].* |
| Multi-value | ✅ |
| Include All option | ✅ |
4️⃣ Item filter (Usage seconds, total)
The Usage seconds, total metric shows actual CPU usage per Pod.
| Setting | Value |
|---|---|
| Name | pod_cpu |
| Label | Pod CPU Usage |
| Query Type | item |
| Group | $Group |
| Host | /.*/ |
| Item Tag | $itemtag |
| Item | /.*/ |
| Regex | ^(Namespace \[(?:${cpu_namespace:regex})\]\s+Pod \[[^\]]+\]\s+CPU: Usage seconds, total)$ |
| Multi-value | ✅ |
| Include All option | ✅ |
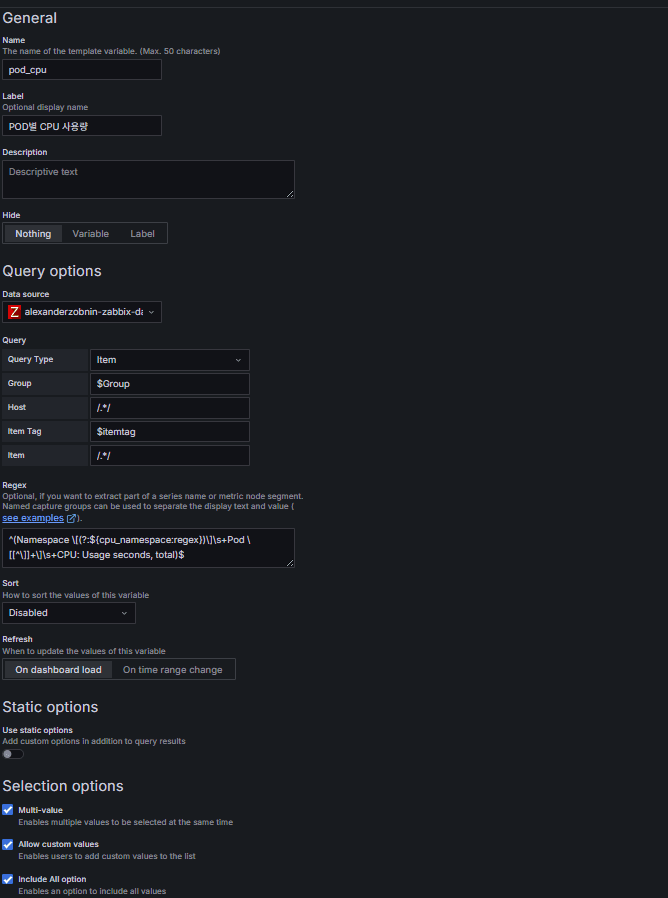
(Note: Grafana versions may handle regex syntax slightly differently. If matching fails, check for extra spaces or escaping rules specific to your version.)
📊 Creating Panels
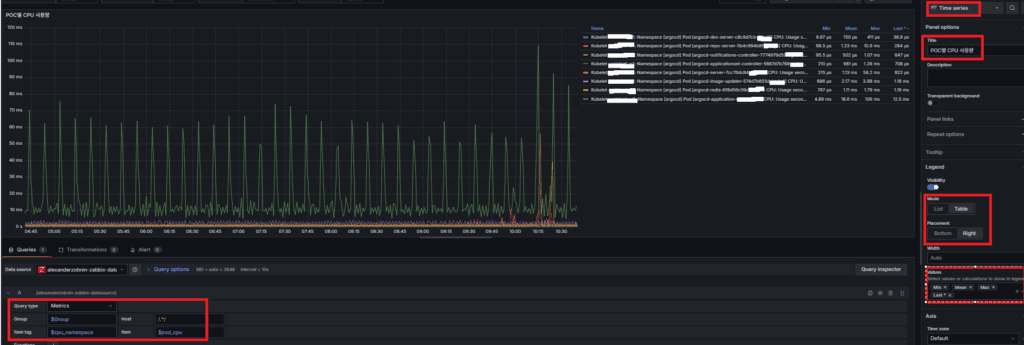
1️⃣ Pod CPU Usage
| Setting | Value |
|---|---|
| Visualization | Time series |
| Title | Pod CPU Usage |
| Mode | Table / Right (optional) |
| Values | Min / Mean / Max / Last* |
| Query Type | Metrics |
| Group | $Group |
| Host | /.*/ |
| Item Tag | $cpu_namespace |
| Item | $pod_cpu |
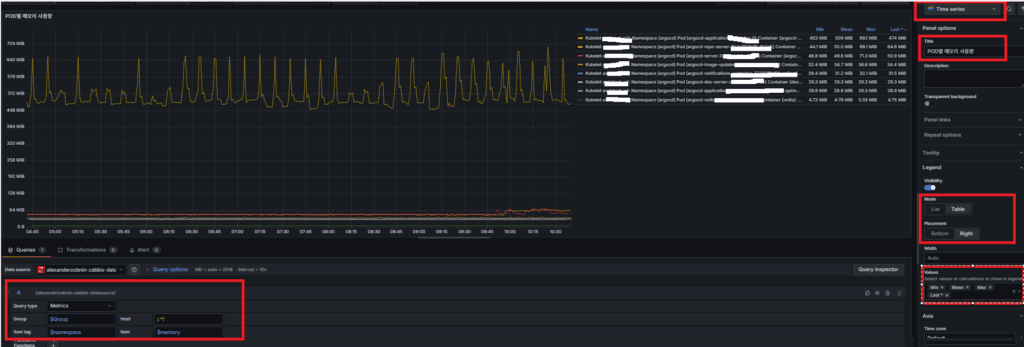
2️⃣ Pod Memory Usage
| Setting | Value |
|---|---|
| Visualization | Time series |
| Title | Pod Memory Usage |
| Mode | Table / Right (optional) |
| Values | Min / Mean / Max / Last* |
| Query Type | Metrics |
| Group | $Group |
| Host | /.*/ |
| Item Tag | $namespace |
| Item | $memory |
💡 Tip
When you select All or multiple namespaces and metrics together and set a long time range (e.g., Last 6 hours),
Grafana may show No data due to heavy I/O load or large query volume.
(All regular expressions used above have been verified in production environments. Because Grafana’s regex parser may vary slightly across major versions, minor syntax differences — mainly around spacing or escaping — might be required.)
Related Post :
🛠 마지막 수정일: 2025.11.12
ⓒ 2025 엉뚱한 녀석의 블로그 [quirky guy's Blog]. All rights reserved. Unauthorized copying or redistribution of the text and images is prohibited. When sharing, please include the original source link.
💡 도움이 필요하신가요?
Zabbix, Kubernetes, 그리고 다양한 오픈소스 인프라 환경에 대한 구축, 운영, 최적화, 장애 분석이 필요하다면 언제든 편하게 연락 주세요.
📧 Contact: jikimy75@gmail.com
💼 Service: 구축 대행 | 성능 튜닝 | 장애 분석 컨설팅
💡 Need Professional Support?
If you need deployment, optimization, or troubleshooting support for Zabbix, Kubernetes, or any other open-source infrastructure in your production environment, feel free to contact me anytime.
📧 Email: jikimy75@gmail.com
💼 Services: Deployment Support | Performance Tuning | Incident Analysis Consulting
답글 남기기
댓글을 달기 위해서는 로그인해야합니다.