Ready to streamline your complex Zabbix operations?
I’ve distilled the most valuable insights from this blog into one essential guide. Take full control of your environment with the Zabbix 7 Enterprise Optimization Handbook [Mastering Hybrid Infrastructure Monitoring with a Kubernetes First Approach].
👉 Get your PDF copy here: https://jikimy.gumroad.com/l/zabbixmaster
Related Posts :
(Fully supports Bare-metal / Kubernetes Pod environments, Agent2 plugin–based)
In Zabbix 7.4, MongoDB monitoring no longer requires additional user scripts. As long as you have the MongoDB plugin built into Zabbix Agent2, it will automatically collect most metrics such as WiredTiger, Replication, and Connections. However, real-world environments fall into two categories:
① MongoDB running on bare-metal (physical/VM) servers
② MongoDB running in Kubernetes Pods and exposed via a Service
Because the network structure of these two environments is completely different, the Agent2 configuration method must also differ. This guide summarizes all those differences based on Zabbix 7.4.
1. Supported Versions
Zabbix
- Zabbix Server/Proxy 7.4 or higher (Compatible with 6.x, but plugin version compatibility must be considered)
- Zabbix Agent2 with MongoDB plugin enabled
MongoDB Engine
- MongoDB versions 4.x to 7.x
✅ Zabbix Design for ReplicaSet Monitoring (Node session–based)
To correctly monitor a ReplicaSet in Zabbix, the following two conditions must be met:
- Performance metrics for each node (WiredTiger, Cursor, Connections, etc.)
- Overall ReplicaSet status (aggregated information based on
rs.status)
It is not possible to combine these two into a single host.
Therefore, the correct approach is to create hosts per node (ReplicaSet = Node unit) and collect performance metrics individually.
Important point:
Zabbix does not provide a “Cluster template” dedicated to ReplicaSets.
(The template MongoDB cluster by Zabbix agent 2 is only for mongos-based sharded clusters and is unrelated to ReplicaSets.)
In other words, the guideline below is the most accurate way to monitor ReplicaSets.
▶ Structural Differences: Kubernetes vs Bare-metal
■ Why it works smoothly in Kubernetes
In Kubernetes, no matter which node the MongoDB Pod is running on,
Zabbix Agent2 installed on the node OS can access all MongoDB Pods via the Service ClusterIP / LoadBalancer IP.
That is:
Agent2 = host node
MongoDB = Pod
Communication = automatically guaranteed by the CNI network
➡ Therefore, even for ReplicaSets, it is possible to configure multiple sessions in Agent2 and monitor them.
■ In Bare-metal environments, installing Agent2 per node
is the standard
In contrast, the structure is different for ReplicaSets built on physical servers (or VMs).
mongo01 server ↔ Agent2 on mongo01
mongo02 server ↔ Agent2 on mongo02
mongo03 server ↔ Agent2 on mongo03
Each MongoDB instance must be in a 1:1 relationship with the Agent2 installed on that server.
Even if you configure a session pointing to MongoDB on another server, it may be difficult to fully collect performance metrics.
➡ Therefore, in Bare-metal ReplicaSet environments,
installing Agent2 on every node is the correct and recommended approach.
▶ mongodb.conf on Agent2 — Defining Sessions (Name Sessions)
Configure sessions like this to access each node in the ReplicaSet.
■ 3-node ReplicaSet session configuration
Plugins.Mongodb.Sessions.rs01.Uri=tcp://mongo01_IP:27017
Plugins.Mongodb.Sessions.rs01.User=zbx_monitor
Plugins.Mongodb.Sessions.rs01.Password=<password>
Plugins.Mongodb.Sessions.rs02.Uri=tcp://mongo02_IP:27017
Plugins.Mongodb.Sessions.rs02.User=zbx_monitor
Plugins.Mongodb.Sessions.rs02.Password=<password>
Plugins.Mongodb.Sessions.rs03.Uri=tcp://mongo03_IP:27017
Plugins.Mongodb.Sessions.rs03.User=zbx_monitor
Plugins.Mongodb.Sessions.rs03.Password=<password>
➡ This is all you need for ReplicaSet environments.
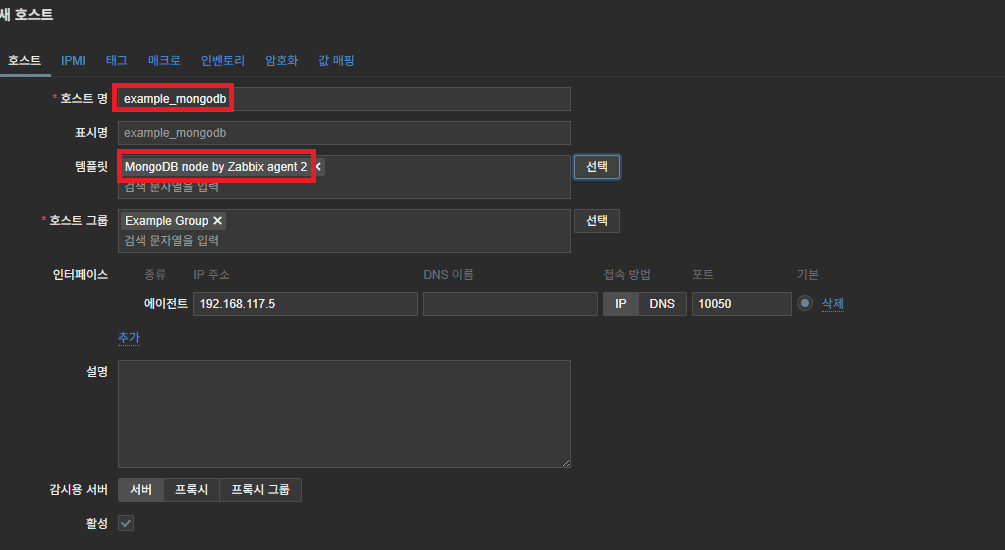
▶ Zabbix Web UI — Host Configuration
■ Three hosts for per-node ReplicaSet monitoring
Each ReplicaSet node must be registered as an independent host.
Host macros:
mongo01 → {$MONGODB.CONNSTRING}=rs01
mongo02 → {$MONGODB.CONNSTRING}=rs02
mongo03 → {$MONGODB.CONNSTRING}=rs03
Apply the following template to each host:
- MongoDB node by Zabbix agent 2
→ Accurately collects node-level performance metrics such as WiredTiger, Cursor, Cache, and Connections.
Environment notes
- Bare-metal: every physical server must have Agent2 installed
- Kubernetes: a single Agent2 on the node OS can access multiple Pods
▶ When do you use the Cluster template?
You do not use it for ReplicaSets.
The Cluster template has only one purpose:
- To monitor the overall shard state in a mongos-based MongoDB sharded cluster.
That is:
- Apply it to the mongos router
- mongos discovers shard nodes via the
get_shardscommand - The discovered mongod nodes automatically get the Node template linked
➡ Since there is no mongos in a ReplicaSet, the Cluster template cannot be applied.
In summary:
- ReplicaSet = use only the Node template
- Sharded Cluster = use a combination of Cluster + Node templates
This is the correct approach that matches Zabbix’s official structure.
▶ Overall Configuration Summary
[mongo01] —— Node template —— rs01
[mongo02] —— Node template —— rs02
[mongo03] —— Node template —— rs03
ReplicaSet monitoring core:
- Node template = performance metrics for each node
- Kubernetes = a single Agent2 can access multiple sessions
- Bare-metal = Agent2 required per node
- Cluster template = unrelated to ReplicaSets (sharding only)
▶ Direction of the Next Installation Guide (Standalone)
In the following practical guide, configuration will be explained based on a single MongoDB node, not a ReplicaSet.
If you want to configure multiple nodes, you only need to adapt this guide slightly.
- Template: MongoDB Node by Zabbix agent 2
- URI: single node
- Session: configure only one
2. Creating a MongoDB Monitoring Account (Common)
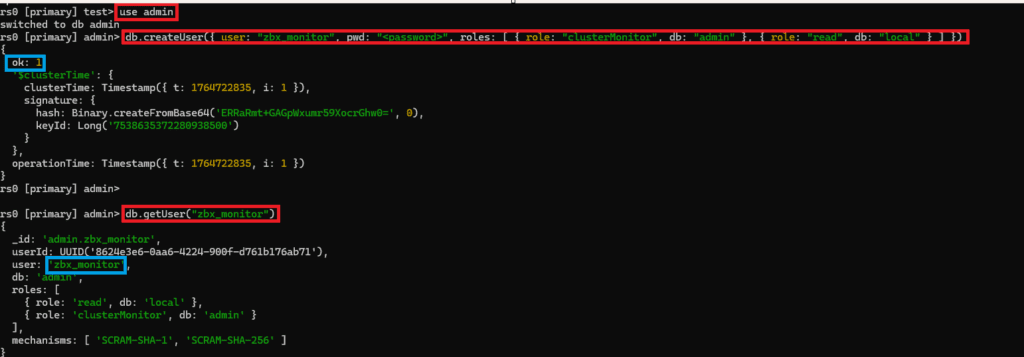
If MongoDB authentication is enabled, it is better to create a dedicated monitoring user. Below is a minimum-privilege example.
- Switch to
admin:
use admin
- Create monitoring user:
db.createUser({
user: “zbx_monitor”,
pwd: “<password>”,
roles: [
{ role: “clusterMonitor”, db: “admin” },
{ role: “read”, db: “local” }
]
})
- Verify that the account was created correctly:
db.getUser(“zbx_monitor”)
The clusterMonitor role is required to query status information, and the read role on the local DB is used to read replication delay information.
3. Checking the Agent2 Plugin Installation Path
The MongoDB plugin must be pre-installed and enabled on Agent2.
If it has been installed correctly, it will be located under a path like the one shown below.

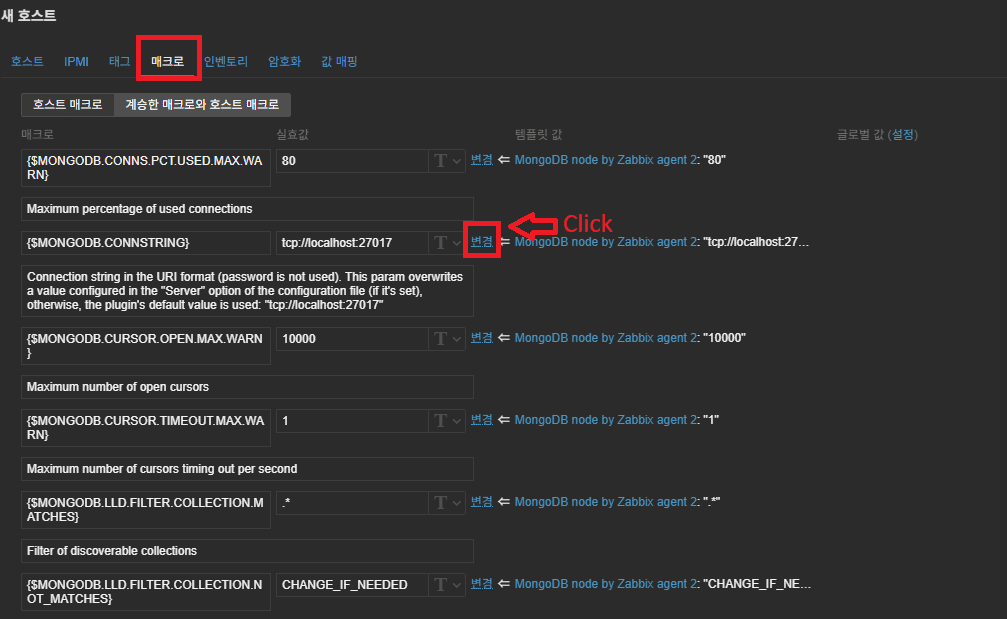
4. Template Macro Method vs Agent2 Session Method
Both methods work, but their characteristics are different.
✔ Template Macro Method
This method overrides the Agent2 configuration using macros defined in the Zabbix UI.
{$MONGODB.CONNSTRING} = tcp://192.168.117.5:27017
{$MONGODB.USER} = zbx_monitor
{$MONGODB.PASSWORD} = <password>
- Advantage: you can quickly modify settings in the UI without editing the plugin config file.
- Disadvantage: the password is exposed in the Zabbix UI.
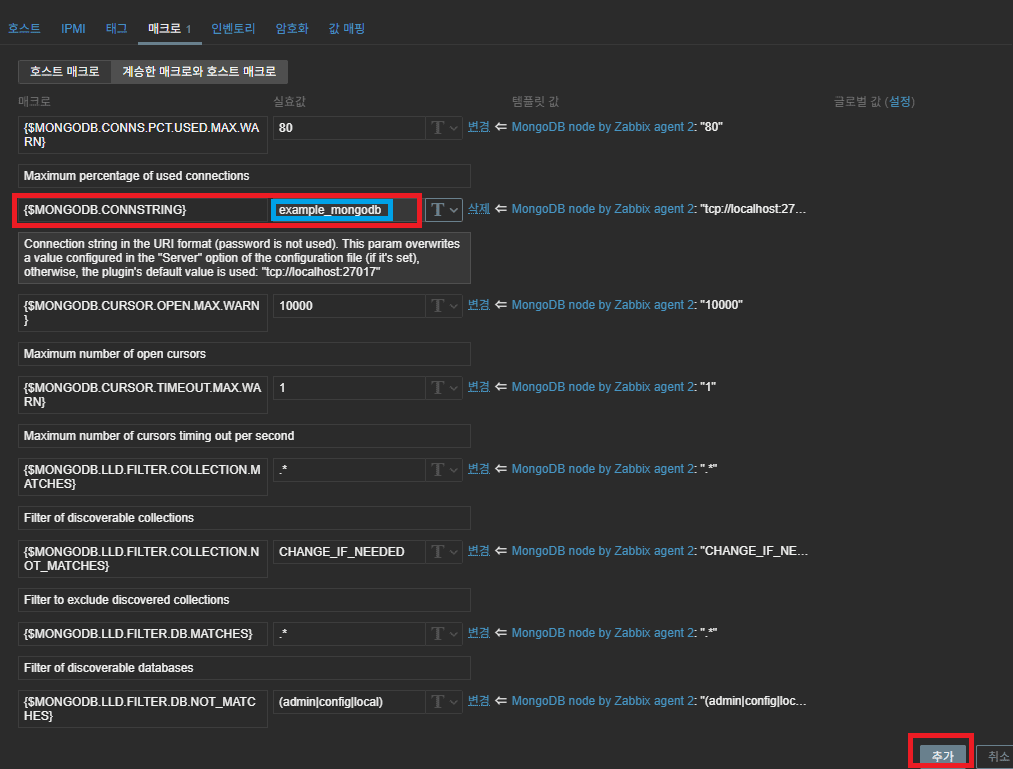
✔ Agent2 Session Method (Recommended)
Install Zabbix Agent2 on the target host, modify the mongodb.conf file, and then restart Agent2.
Default values
Plugins.Mongodb.Sessions.*.Uri=
Plugins.Mongodb.Sessions.*.User=
Plugins.Mongodb.Sessions.*.Password=
Modified values
Plugins.Mongodb.Sessions.example_mongodb.Uri=tcp://192.168.117.5:27017
Plugins.Mongodb.Sessions.example_mongodb.User=zbx_monitor
Plugins.Mongodb.Sessions.example_mongodb.Password=<password>

In the Zabbix Web UI template macros, set the session name like this:
{$MONGODB.CONNSTRING} = example_mongodb
Plugin configuration tips
(Method A) Single MongoDB monitoring using only Default values
If there is only one MongoDB instance, use the Plugins.Mongodb.Default section.
Plugins.Mongodb.Default.Uri=tcp://192.168.117.5:27017
Plugins.Mongodb.Default.User=zbx_monitor
Plugins.Mongodb.Default.Password=<password>
In the Zabbix Web UI, macros can be left empty or kept as defaults.
(Method B) Multi-instance monitoring using Sessions (also works for single instance)
This is suitable when monitoring multiple DBs or multiple sessions.
Assign a name to each session and define it as shown above.
5. Configuring Monitoring for MongoDB in Kubernetes Pods
Agent2 runs on the host (OS), while MongoDB runs inside the Pod.
Because a Pod’s ClusterIP cannot be accessed from outside, you must always access it via a Service (NodePort or LoadBalancer).
The most practical method is as follows.
Monitoring based on LoadBalancer External IP
● K8s structure
Agent2 (Host) → Service External IP → MongoDB Pod
● Example External IP
192.168.117.90:27017
● mongodb.conf configuration
Plugins.Mongodb.Sessions.K8s.Uri=tcp://192.168.117.90:27017
Plugins.Mongodb.Sessions.K8s.User=zbx_monitor
Plugins.Mongodb.Sessions.K8s.Password=<password>
Zabbix Web UI macros:
{$MONGODB.CONNSTRING} = K8s
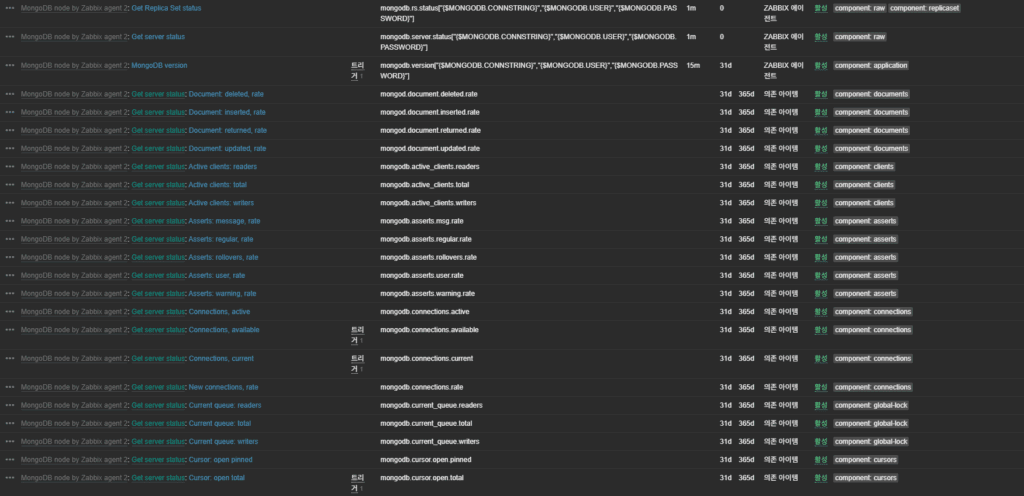
6. Metrics: Main Collected Items
The MongoDB plugin collects the following key metrics.
Connections
- Current number of connections
- Usage ratio against max connections
(Trigger macro: {$MONGODB.CONNS.PCT.USED.MAX.WARN})
Cursors
- Number of open cursors
- Timeout ratio
({$MONGODB.CURSOR.TIMEOUT.MAX.WARN}, {$MONGODB.CURSOR.OPEN.MAX.WARN})
WiredTiger
- Read/write ticket availability
({$MONGODB.WIRED_TIGER.TICKETS.AVAILABLE.MIN.WARN})
7. Troubleshooting Checklist
1) Bare-metal environments
- URI typos – forgetting
tcp://or specifying the wrong port is a major cause of connection failure. - Bind address – if
bindIpinmongod.confis set to127.0.0.1, external access is not possible. Change it to0.0.0.0or add the required IP addresses. - Firewall – check whether port 27017 is blocked by the OS firewall or cloud security groups.
- SELinux/AppArmor blocking – security modules may block access from Agent2, so adjust or disable the relevant policies.
2) Kubernetes environments
- NetworkPolicy blocking – confirm that the NetworkPolicy applied to the namespace allows Ingress traffic from Zabbix Agent2.
- Service External IP changes – if the LoadBalancer is recreated or nodes are restarted, the External IP can change. Zabbix host macros must be updated accordingly.
- Readiness probe failure – even if the MongoDB Pod is in the Running state, a failing readiness probe will exclude it from the Service’s Endpoints list, blocking access.
8. Conclusion
MongoDB monitoring in a Zabbix 7.4 environment can be summarized in one sentence:
As long as you correctly specify the URI that Agent2 uses to connect to MongoDB, everything else is handled automatically.
- Plugin path:
/etc/zabbix/zabbix_agent2.d/plugins.d/ - UserParameter is not needed from 6.0 onward
- For monitoring MongoDB in K8s Pods, use the External IP
- The session-based method offers the best stability, security, and scalability
It does not matter whether the runtime environment is bare-metal or Pods.
If the URI configuration is correct, Zabbix becomes a powerful MongoDB monitoring platform that is independent of the underlying environment.
🛠 마지막 수정일: 2025.12.12
ⓒ 2025 엉뚱한 녀석의 블로그 [quirky guy's Blog]. All rights reserved. Unauthorized copying or redistribution of the text and images is prohibited. When sharing, please include the original source link.
💡 도움이 필요하신가요?
Zabbix, Kubernetes, 그리고 다양한 오픈소스 인프라 환경에 대한 구축, 운영, 최적화, 장애 분석,
광고 및 협업 제안이 필요하다면 언제든 편하게 연락 주세요.
📧 Contact: jikimy75@gmail.com
💼 Service: 구축 대행 | 성능 튜닝 | 장애 분석 컨설팅
📖 E-BooK [PDF] 전자책 (Gumroad):
Zabbix 엔터프라이즈 최적화 핸드북
블로그에서 다룬 Zabbix 관련 글들을 기반으로 실무 중심의 지침서로 재구성했습니다.
운영 환경에서 바로 적용할 수 있는 최적화·트러블슈팅 노하우까지 모두 포함되어 있습니다.
💡 Need Professional Support?
If you need deployment, optimization, or troubleshooting support for Zabbix, Kubernetes,
or any other open-source infrastructure in your production environment, or if you are interested in
sponsorships, ads, or technical collaboration, feel free to contact me anytime.
📧 Email: jikimy75@gmail.com
💼 Services: Deployment Support | Performance Tuning | Incident Analysis Consulting
📖 PDF eBook (Gumroad):
Zabbix Enterprise Optimization Handbook
A single, production-ready PDF that compiles my in-depth Zabbix and Kubernetes monitoring guides.
답글 남기기
댓글을 달기 위해서는 로그인해야합니다.