📘 Overview
If you’ve completed the Grafana installation and service setup in Part 1, this section walks through connecting Zabbix data to Grafana.
In this guide, we’ll install the official Grafana plugin
Zabbix Plugin (alexanderzobnin-zabbix-app)
and configure it to fetch real-time metrics from the Zabbix API.
This plugin isn’t just for displaying charts — it enables Grafana to directly query Zabbix hosts, items, and triggers, effectively transforming Zabbix into a full-featured data source.
1. Installing the Zabbix Plugin
Grafana manages plugins through the grafana-cli command.
To install the Zabbix plugin, run:
# grafana-cli plugins install alexanderzobnin-zabbix-app
After installation, restart Grafana:
# systemctl restart grafana-server
✅ Verification command:
grafana-cli plugins ls
If you see alexanderzobnin-zabbix-app listed, the installation was successful.
2. Enabling the Plugin
Log in to Grafana →
Administration → Plugins and data → Plugins
Search for “zabbix”, click Zabbix, and then click Enable.
💡 Since Grafana 10.x, the plugin management structure has changed.
You can now enable it only under Plugins and data.
It no longer appears under Configuration → Plugins as in older versions.
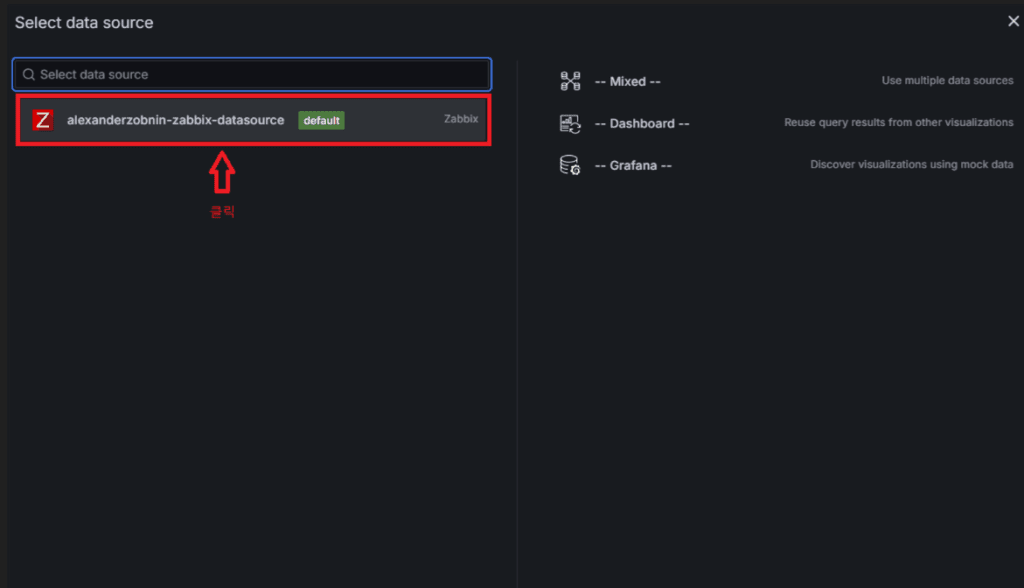
3. Adding the Zabbix Data Source
Once the plugin is enabled, register Zabbix as a data source:
Menu → Connections → Data sources → Add data source
→ Select Zabbix
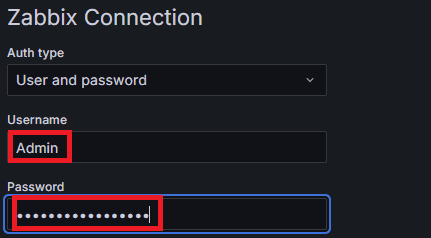
3.1 Connection Settings
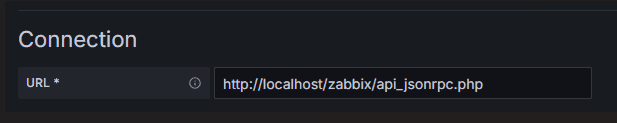
| Field | Example Value | Description |
|---|---|---|
| URL (same server) | http://localhost/zabbix/api_jsonrpc.php | Use if Grafana and Zabbix are on the same host |
| URL (remote server) | http://<ZABBIX_IP>/zabbix/api_jsonrpc.php | Use IP or domain for external Zabbix server |
| Username | Admin | Zabbix login account |
| Password | zabbix | Default password (change it for security) |
⚠️ Note:
Grafana must be able to reach the Zabbix API endpoint.
If it’s blocked by a firewall, proxy, or Nginx ACL, the connection will fail.
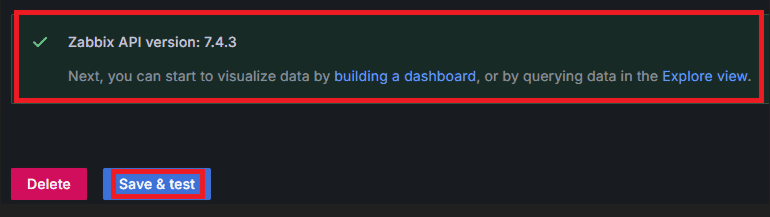
3.2 Testing the Connection
After entering all fields, click Save & Test.
A success message should appear at the bottom.
💬 If the test fails, check the following:
- Ensure the URL ends with
/api_jsonrpc.php. - Test the API manually from the Grafana server:
curl -X POST -H "Content-Type: application/json" \
 -d '{"jsonrpc":"2.0","method":"apiinfo.version","id":1}' \
 http://<ZABBIX_IP>/zabbix/api_jsonrpc.php
4. Verifying with a Test Panel
After installation, create a simple dashboard to confirm everything works:
- Dashboards → New → Dashboard → Add Visualization
- Data Source: Zabbix
- Query Type: Metrics
- Select Group / Host / Item, for example:
- Group: Example Grouup
- Host: example Server 01
- Item: CPU utilization
If the graph renders successfully, the integration is complete.
💡 Tip:
Groups, hosts, and items must already be configured in Zabbix.
Standard templates (CPU, Memory, Disk, etc.) appear automatically,
but you can also query additional item keys directly from the Zabbix server.
5. Troubleshooting
| Issue | Cause | Solution |
|---|---|---|
| Zabbix API version not found | Incorrect API path (/api_jsonrpc.php) | Enter the correct URL |
| 401 Unauthorized | Invalid credentials | Verify Zabbix username / password |
| Network Error | Firewall / proxy blocking | Test API access with curl |
| Plugin not found | Wrong installation path | Check /var/lib/grafana/plugins and reinstall |
6. Coming Next
In the next article, we’ll build a production-ready Grafana dashboard
that consolidates key metrics — CPU, Memory, Disk, and Network —
into a clear and actionable single-view layout.
🛠 마지막 수정일: 2025.11.07
ⓒ 2025 엉뚱한 녀석의 블로그 [quirky guy's Blog]. All rights reserved. Unauthorized copying or redistribution of the text and images is prohibited. When sharing, please include the original source link.
💡 도움이 필요하신가요?
Zabbix, Kubernetes, 그리고 다양한 오픈소스 인프라 환경에 대한 구축, 운영, 최적화, 장애 분석이 필요하다면 언제든 편하게 연락 주세요.
📧 Contact: jikimy75@gmail.com
💼 Service: 구축 대행 | 성능 튜닝 | 장애 분석 컨설팅
💡 Need Professional Support?
If you need deployment, optimization, or troubleshooting support for Zabbix, Kubernetes, or any other open-source infrastructure in your production environment, feel free to contact me anytime.
📧 Email: jikimy75@gmail.com
💼 Services: Deployment Support | Performance Tuning | Incident Analysis Consulting
답글 남기기
댓글을 달기 위해서는 로그인해야합니다.