Ready to streamline your complex Zabbix operations?
I’ve distilled the most valuable insights from this blog into one essential guide. Take full control of your environment with the Zabbix 7 Enterprise Optimization Handbook [Mastering Hybrid Infrastructure Monitoring with a Kubernetes First Approach].
👉 Get your PDF copy here: https://jikimy.gumroad.com/l/zabbixmaster
By default, Zabbix Kubernetes templates provide only basic metrics such as CPU, memory, disk, node status, and container status. Pod-level network traffic is missing.
In many environments, this gap is covered by Prometheus. Here, however, is a case study where Zabbix alone was extended to collect Pod-level RX/TX traffic metrics.
This design was built from scratch without external references and has already been validated in a production environment.
I recommend reading the previous post, “Zabbix for Kubernetes Monitoring” before continuing.
Design Overview
- Data source: Kubelet cAdvisor metrics
- Collection flow: HTTP agent → Master item → Discovery (LLD) → Item prototypes → Preprocessing chain
- Goal: Per-Pod / Namespace / Interface RX and TX traffic, expressed in bps
1. Master Item
- Use
Kubernetes Kubelet by HTTP: Get cadvisor metricsas the master item. - All Discovery rules and item prototypes depend on this data.

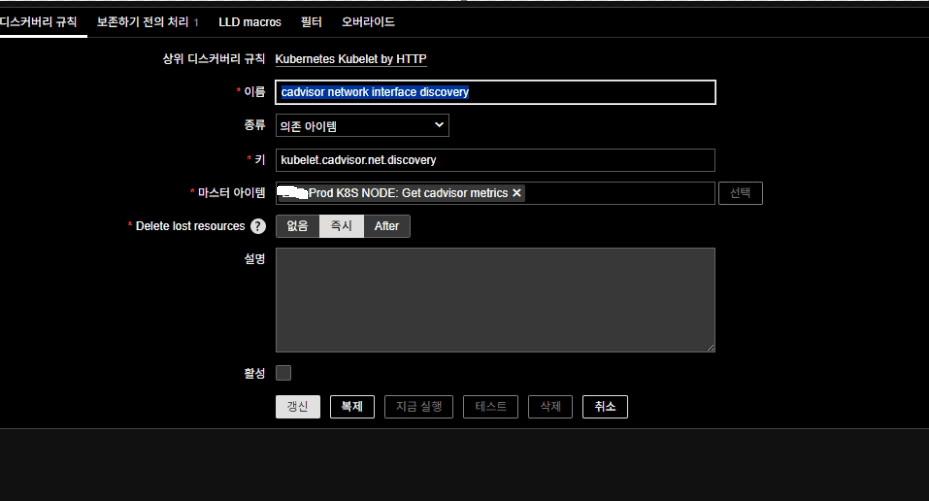
2. Discovery Rule (Prod K8S NODE)
Zabbix Web UI → Data Collection → Hosts → select the target host → Discovery → Create Discovery Rule
- Name:
cadvisor network interface discovery - Type: Dependent item
- Key:
kubelet.cadvisor.net.discovery - Master item:
Prod-K8S NODE: Get cadvisor metrics
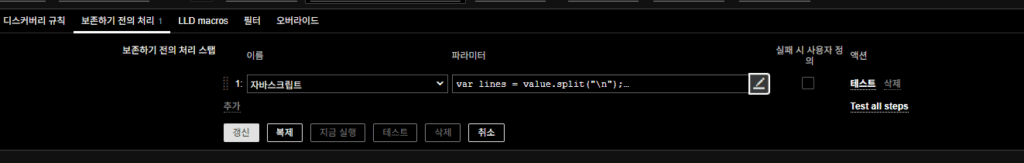
Preprocessing (JavaScript)
Extract Pod, Namespace, and Interface. Deduplicate results.
var lines = value.split("\n");
var seen = {};
var result = [];

for (var i = 0; i < lines.length; i++) {
    // Filter only RX metrics
    var match = lines[i].match(/^container_network_receive_bytes_total\{([^}]+)\}/);
    if (!match) continue;

    var labelBlock = match[1];
    var iface = (labelBlock.match(/interface="([^"]+)"/) || [])[1];
    var pod   = (labelBlock.match(/pod="([^"]+)"/) || [])[1];
    var ns    = (labelBlock.match(/namespace="([^"]+)"/) || [])[1];

    // Skip if any label is missing
    if (!iface || !pod || !ns) continue;

    var key = iface + pod + ns;
    if (seen[key]) continue;
    seen[key] = true;

    result.push({
        "{#IFACE}": iface,
        "{#POD}": pod,
        "{#NAMESPACE}": ns
    });
}

return JSON.stringify({ data: result });
3. Item Prototypes
Collect per-Pod RX/TX bytes and convert to bps.
A. RX Traffic
Click the Item Prototypes of the created Discovery rule -> Create a new Item Prototype.
- Name:
RX: [{#NAMESPACE}] {#POD} ({#IFACE}) - Type: Dependent item
- Key:
cadvisor.net.rx[{#IFACE},{#POD},{#NAMESPACE}] - Unit: bps
- Type: Dependent item (float)
- Master item:
Prod K8S NODE: Get cadvisor metrics
Preprocessing Chain
- JavaScript – extract latest RX value
var lines = value.split("\n");
var iface = "{#IFACE}";
var pod   = "{#POD}";
var ns    = "{#NAMESPACE}";
var latestTs = 0;
var latestVal = 0;

for (var i = 0; i < lines.length; i++) {
    var m = lines[i].match(/^container_network_receive_bytes_total\{([^}]+)\}\s+([0-9.eE+-]+)\s+(\d+)$/);
    if (!m) continue;

    var labels = m[1];
    var val = parseFloat(m[2]);
    var ts  = parseInt(m[3]);

    if (labels.includes('interface="' + iface + '"') &&
        labels.includes('pod="' + pod + '"') &&
        labels.includes('namespace="' + ns + '"')) {
        if (ts > latestTs) {
            latestTs = ts;
            latestVal = val;
        }
    }
}

if (latestTs > 0) return latestVal;
throw "No matching metric found";
- Change per second – calculate delta per second (Byte/s)
- JavaScript – convert Byte → bit
return value * 8; // Byte → bit
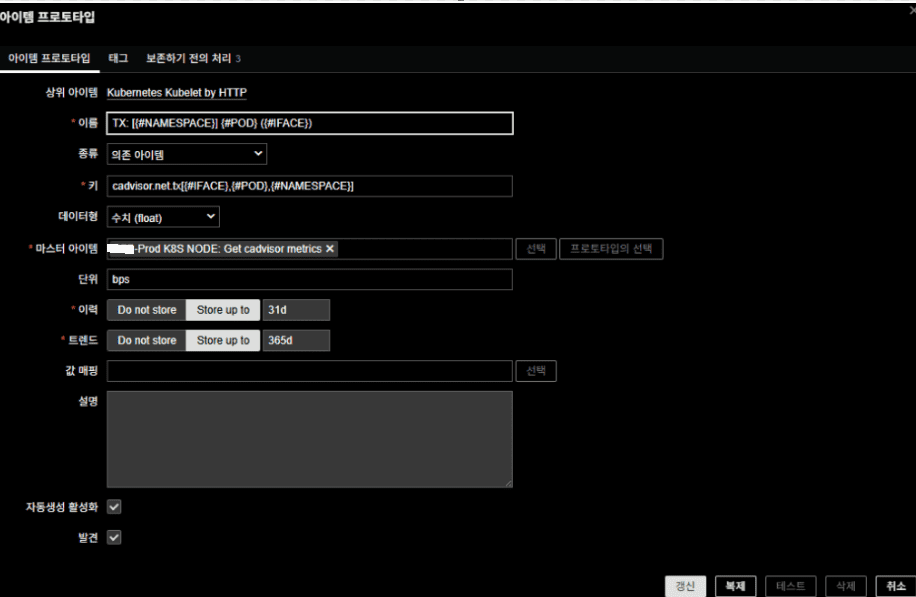
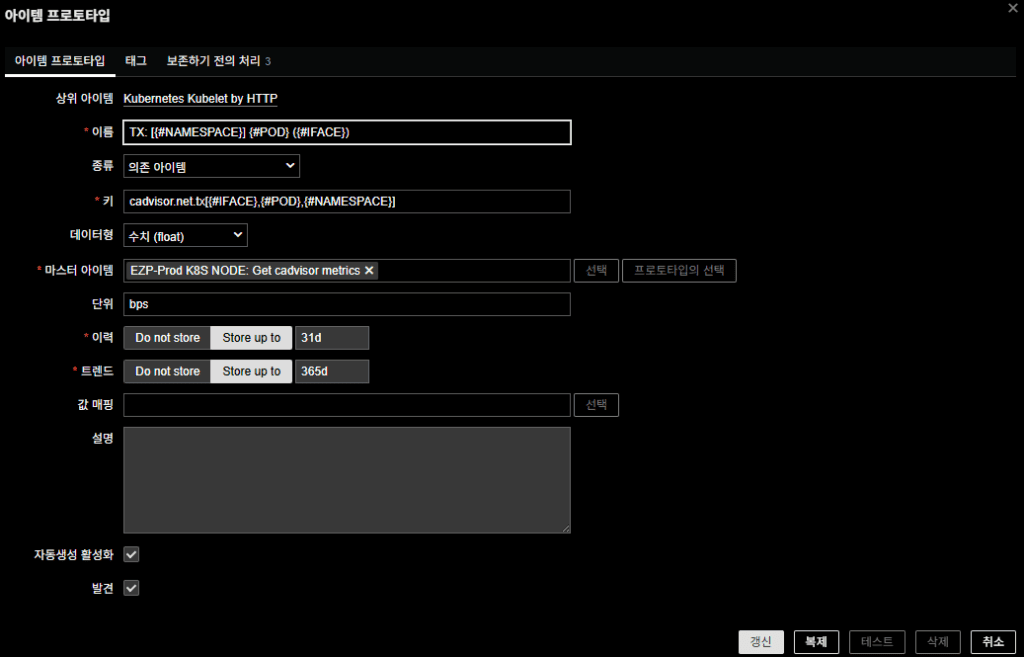
B. TX Traffic
Click the Item Prototypes of the created Discovery rule -> Create a new Item Prototype.
- Name:
TX: [{#NAMESPACE}] {#POD} ({#IFACE}) - Type: Dependent item
- Key:
cadvisor.net.tx[{#IFACE},{#POD},{#NAMESPACE}] - Unit: bps
- Type: Dependent item (float)
- Master item:
Prod K8S NODE: Get cadvisor metrics
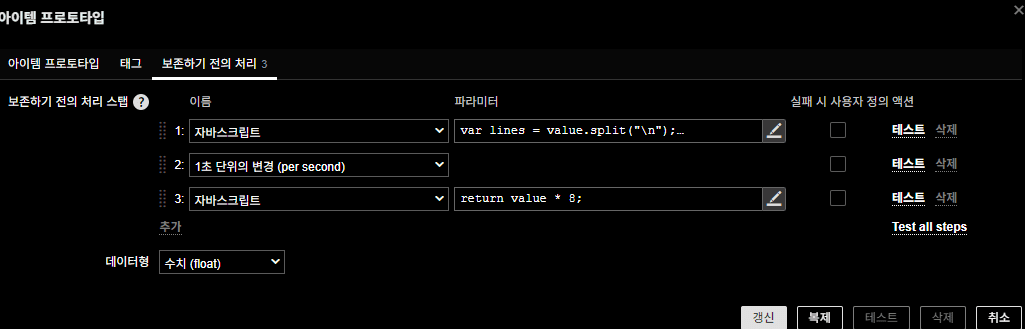
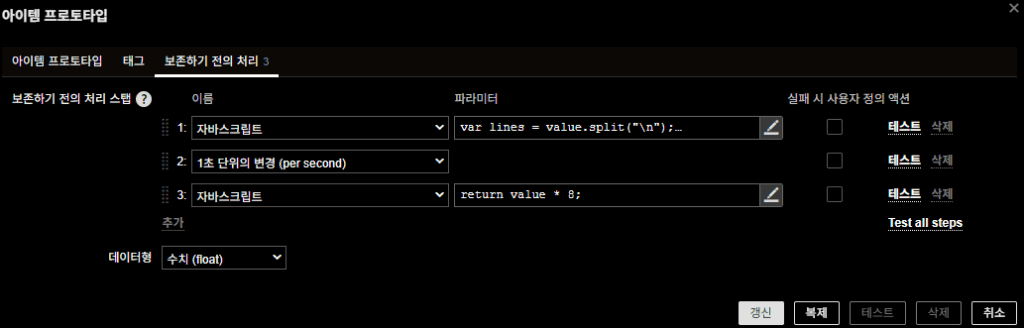
Preprocessing Chain
- JavaScript – extract latest TX value
var lines = value.split("\n");
var iface = "{#IFACE}";
var pod   = "{#POD}";
var ns    = "{#NAMESPACE}";
var latestTs = 0;
var latestVal = 0;

for (var i = 0; i < lines.length; i++) {
    var m = lines[i].match(/^container_network_transmit_bytes_total\{([^}]+)\}\s+([0-9.eE+-]+)\s+(\d+)$/);
    if (!m) continue;

    var labels = m[1];
    var val = parseFloat(m[2]);
    var ts  = parseInt(m[3]);

    if (labels.includes('interface="' + iface + '"') &&
        labels.includes('pod="' + pod + '"') &&
        labels.includes('namespace="' + ns + '"')) {
        if (ts > latestTs) {
            latestTs = ts;
            latestVal = val;
        }
    }
}

if (latestTs > 0) return latestVal;
throw "No matching metric found";
- Change per second – calculate delta per second (Byte/s)
- JavaScript – convert Byte → bit
return value * 8; // Byte → bit
Tip.
If the {$KUBE.KUBELET.URL} macro configured on the Prod K8S NODE host was pointing to the master node’s IP, then Zabbix would only collect network metrics for the Pods running on the master node. This behavior follows from the structural nature of cAdvisor, which provides information only for containers running on the node where that cAdvisor instance exists. As a result, the traffic of application Pods running on other nodes cannot be viewed through this setup.
Therefore, to collect Pod traffic from each node, you must add that node as a separate host in Zabbix and set its {$KUBE.KUBELET.URL} value to:
https://<NODE_IP>:10250
By specifying the cAdvisor endpoint for each node individually, Zabbix can accurately collect Pod traffic metrics across the entire Kubernetes cluster.
Compared to Prometheus—which automatically scrapes all nodes from a central point—Zabbix requires per-node configuration, which is inevitably more cumbersome. Please refer to the details below.
cAdvisor characteristics and the need for per-node configuration
When collecting Kubernetes Pod traffic with Zabbix, one essential fact must be understood:
cAdvisor runs inside each node’s kubelet and exposes metrics only for the containers that exist on that specific node. In other words, the master node can only observe the system Pods scheduled on the master, while the traffic of application Pods running on worker nodes can only be retrieved by querying those worker nodes directly.
Because of this characteristic, if discovery is performed against a single node (such as the master), Zabbix will only detect system components like kube-proxy, calico-node, and node-local-dns, which exist on that node. Application Pods generating real business traffic will not be discovered at all. Therefore, to collect Pod-level network metrics across the cluster, all nodes must be registered individually as Zabbix hosts, and each node’s cAdvisor endpoint must be queried directly.
To accomplish this, attach the Kubernetes Kubelet by HTTP template to each node host and set the kubelet cAdvisor URL in the host macro as follows:
{$KUBE.KUBELET.URL} = https://<NODE_IP>:10250
For example, if multiple worker nodes exist, assign separate values to each host:
https://192.168.50.11:10250
https://192.168.50.12:10250
https://192.168.50.13:10250
Once this is configured, the template applied to each node will directly query that node’s kubelet cAdvisor data, and the discovery rule defined per node will generate RX/TX items based on the Pods actually running on that node.
In other words, discovery operates independently on each node:
- System-level components, which exist on all nodes, will be detected on multiple nodes.
- Application Pod traffic is collected only on the node where the Pod is actually running, ensuring accurate per-node network data collection.
4. Trigger Strategy
Physical network interfaces are already monitored separately.
Pod-level metrics here are used for traffic flow analysis only.
No triggers were defined, though it would be straightforward to extend prototypes into alert conditions if needed.
5. Practical Value
- Overcomes the limitation of default Zabbix templates.
- Provides Pod-level network visibility without Prometheus.
- Discovery + prototype structure ensures automatic scaling with new Pods.
- Validated in a production environment.
This design turns Zabbix from a simple node/resource monitoring tool into a solution capable of covering Pod-level network traffic as well.
🛠 마지막 수정일: 2025.12.22
ⓒ 2025 엉뚱한 녀석의 블로그 [quirky guy's Blog]. All rights reserved. Unauthorized copying or redistribution of the text and images is prohibited. When sharing, please include the original source link.
💡 도움이 필요하신가요?
Zabbix, Kubernetes, 그리고 다양한 오픈소스 인프라 환경에 대한 구축, 운영, 최적화, 장애 분석,
광고 및 협업 제안이 필요하다면 언제든 편하게 연락 주세요.
📧 Contact: jikimy75@gmail.com
💼 Service: 구축 대행 | 성능 튜닝 | 장애 분석 컨설팅
📖 E-BooK [PDF] 전자책 (Gumroad):
Zabbix 엔터프라이즈 최적화 핸드북
블로그에서 다룬 Zabbix 관련 글들을 기반으로 실무 중심의 지침서로 재구성했습니다.
운영 환경에서 바로 적용할 수 있는 최적화·트러블슈팅 노하우까지 모두 포함되어 있습니다.
💡 Need Professional Support?
If you need deployment, optimization, or troubleshooting support for Zabbix, Kubernetes,
or any other open-source infrastructure in your production environment, or if you are interested in
sponsorships, ads, or technical collaboration, feel free to contact me anytime.
📧 Email: jikimy75@gmail.com
💼 Services: Deployment Support | Performance Tuning | Incident Analysis Consulting
📖 PDF eBook (Gumroad):
Zabbix Enterprise Optimization Handbook
A single, production-ready PDF that compiles my in-depth Zabbix and Kubernetes monitoring guides.
답글 남기기
댓글을 달기 위해서는 로그인해야합니다.